国内お問い合わせ窓口
info@displaysupplychain.co.jp
FOR IMMEDIATE RELEASE: 09/13/2021
Display Equipment Suppliers Show Improved Financial Health on Semiconductor Surge, Display Eqpt. Bookings Surge
Ross Young, Founder and CEOAustin, TX USA -
Display equipment suppliers continue to get healthy with all margins rising as revealed in DSCC’s latest Quarterly Display Supply Chain Financial Health Report (一部実データ付きサンプルをお送りします). This is a result of the semiconductor side of the business enjoying record revenues and margins on strong demand from the semiconductor shortage with companies sold out and reporting extended leadtimes. In fact, some companies are indicating extended leadtimes for a number of components found in semiconductor and display equipment such as microcontroller chips and high temperature materials such as quartz and ceramic.
Total equipment revenues for 36 leading display equipment suppliers rose 4% Q/Q and 34% Y/Y to $24.8B, a new high. The top 4 remained the same with SEMES overtaking SCREEN for #5. The top 10 companies accounted for a 93% share. Display equipment revenues for these companies rose 1% Q/Q and 60% Y/Y to $2.8B, while display equipment spending on an install basis fell 9% Q/Q while rising 72% Y/Y to $5.6B, indicating the top suppliers in our survey are gaining share. Revenues for the 36 suppliers amounted to 41% of display capex and 50% of total equipment spending.
Capital intensity continues to fall in the display industry as panel suppliers take advantage of tight supply and higher prices. AUO had capital intensity of just 3% in Q2’21 with SDC at 9%, LGD at 13% and Chinese suppliers much higher at 17% – 82%. With display prices falling, revenues peaking and capex holding steady to rising as new display technologies come to market, we will likely see capital intensity start to rise again. It was at an all-time low of just 13% in Q2’21. However, display equipment bookings for 20 surveyed companies rose 23% Q/Q and 124% Y/Y as display manufacturers respond to record profits with new capex.
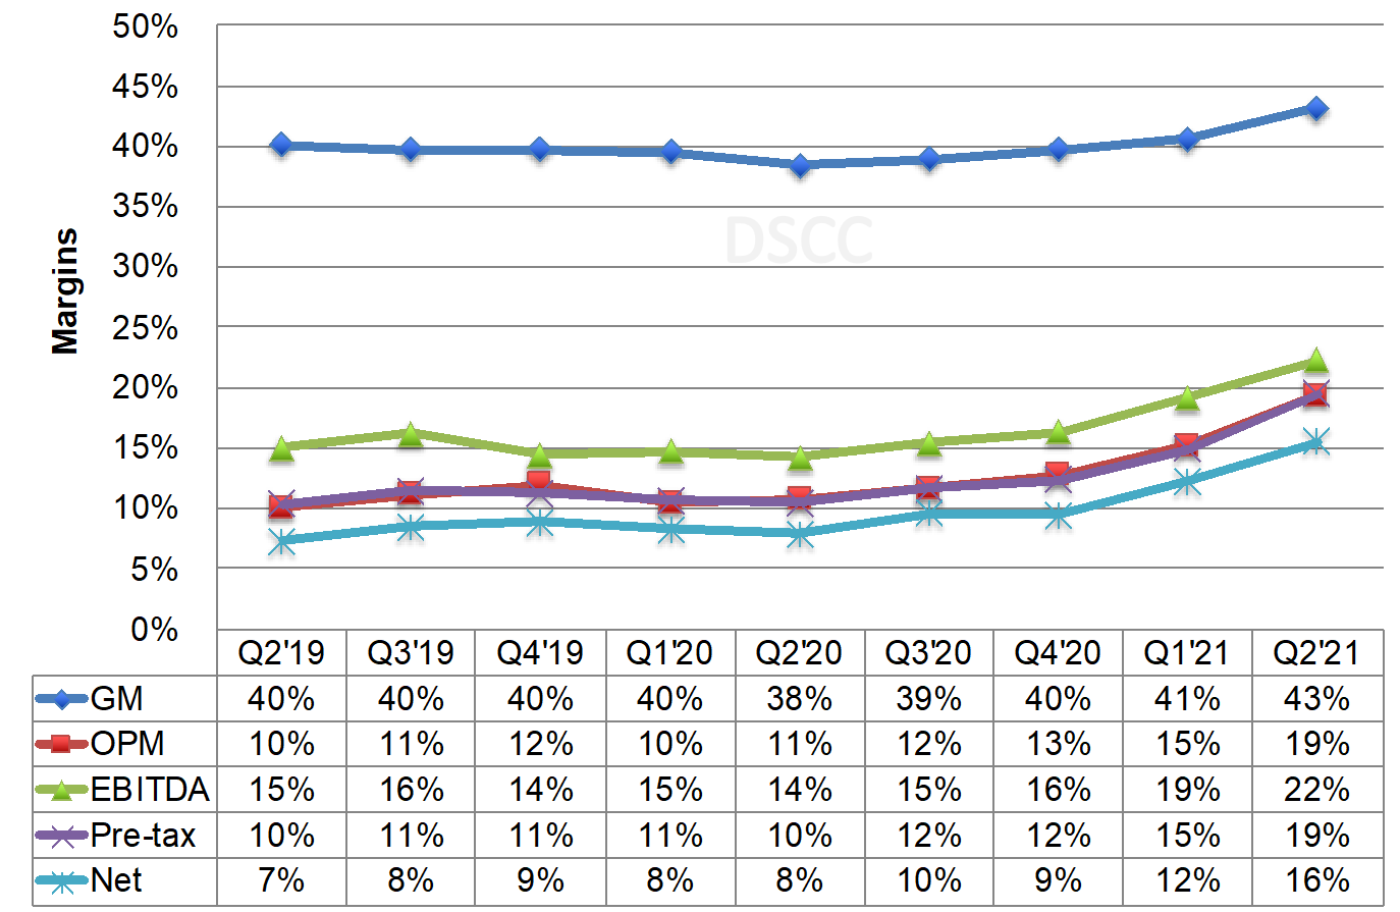
Margins improved across all metrics and was likely the most profitable quarter in the history of the equipment industry.
- Gross margins rose from 41% to 43%;
- Operating margins rose from 15% to 19%;
- EBITDA margins rose from 19% to 22%;
- Pre-tax profit margins rose from 15% to 19%;
- Net margins rose from 12% to 16%;
- Operating cash flow surged 34% Q/Q and 88% Y/Y to a record high $4.6B. AMAT, Canon and TEL accounted for 88% of these 36 companies’ operating cash flow, up from 87% last quarter;
- Free cash flow rose 36% Q/Q while rising 161% Y/Y to a record $3.745B. AMAT, Canon and TEL accounted for 90% of free cash flow, up from 80% last quarter.
Margins for 36 Display Equipment Suppliers
Looking at just the display equipment businesses, operating income rose 82% Q/Q and 54% Y/Y to $840M, the highest since Q3’18. Operating margins for the display equipment businesses rose from 7% to 12%. Based on our estimates of Canon’s VTE revenues which are not publicly disclosed, we show Canon leading for the 3rd straight quarter. The top 4 remained the same with AMAT and Nikon gaining share with TEL losing share. AP Systems rose from #7 to #5. Companies gaining share in the top 15 included AMAT, Nikon, AP Systems, EO Technics, Wuhan Jingce, Top Eng., DMS and Contrel.
On an operating margin basis, Device Eng. led at 30% followed by EO Technics, Wonik IPS, AMAT and Nikon. Seven companies had negative operating margins. For more information on DSCC’s Quarterly Display Supply Chain Financial Health Report (一部実データ付きサンプルをお送りします), please contact info@displaysupplychain.co.jp.
About Counterpoint
https://www.displaysupplychain.co.jp/about
[一般のお客様:本記事の出典調査レポートのお引き合い]
上記「国内お問い合わせ窓口」にて承ります。会社名・部署名・お名前、および対象レポート名またはブログタイトルをお書き添えの上、メール送信をお願い申し上げます。和文概要資料、商品サンプル、国内販売価格を返信させていただきます。
[報道関係者様:本記事の日本語解説&データ入手のご要望]
上記「国内お問い合わせ窓口」にて承ります。媒体名・お名前・ご要望内容、および必要回答日時をお書き添えの上、メール送信をお願い申し上げます。記者様の締切時刻までに、国内アナリストが最大限・迅速にサポートさせていただきます。