国内お問い合わせ窓口
info@displaysupplychain.co.jp
FOR IMMEDIATE RELEASE: 09/13/2021
Double-Digit Capacity Growth in 2022 Points to Continued Pricing Pressure
Ross Young, Founder and CEOAustin, TX USA -
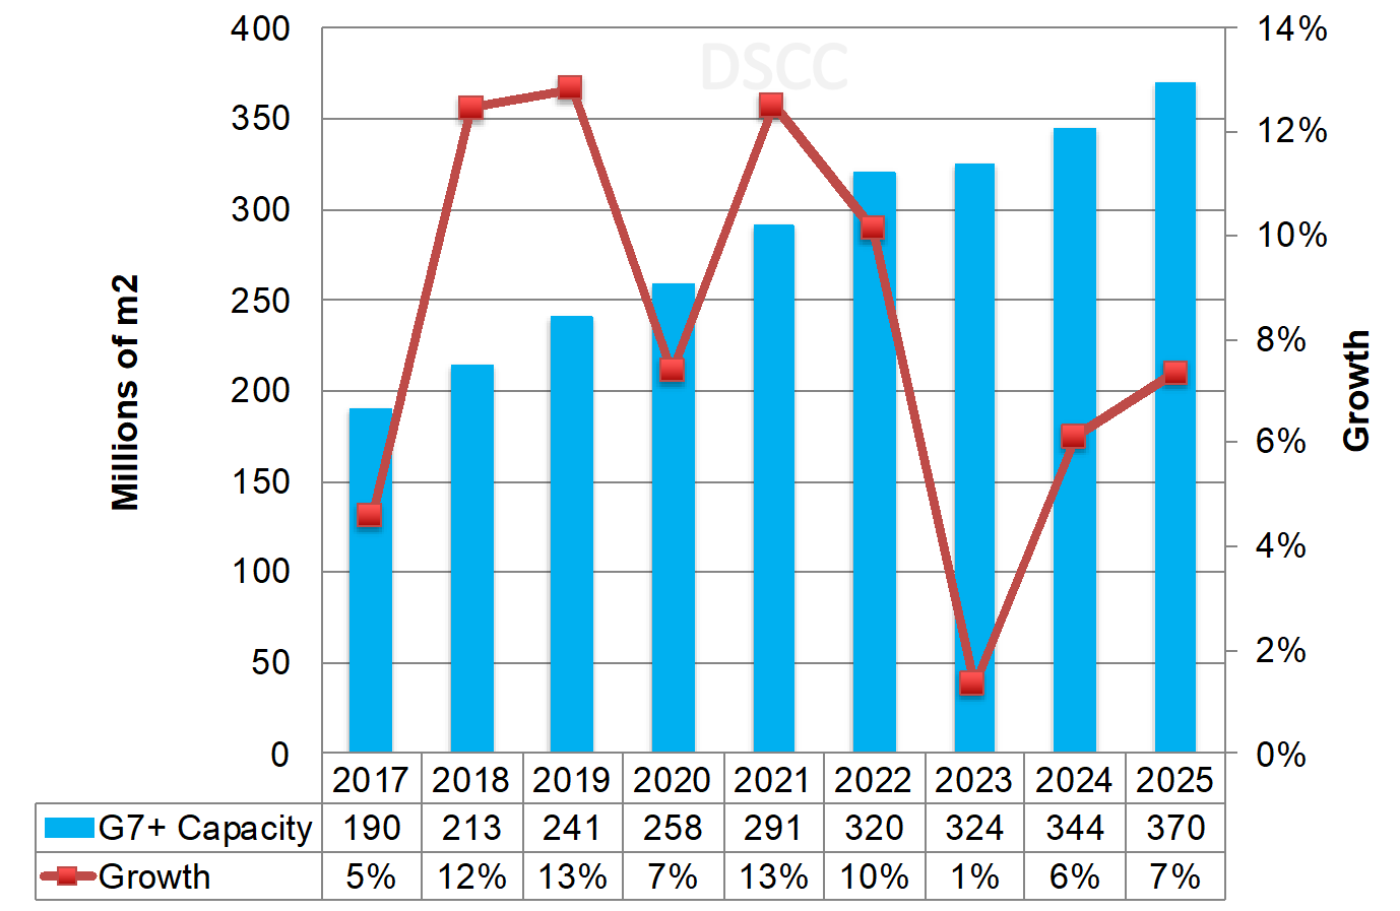
DSCC’s latest quarterly display capacity update (一部実データ付きサンプルをお送りします) should create a concern among large-area display suppliers and an opportunity for buyers. DSCC expects G7+ capacity to rise 10% in 2022 after a 13% increase in 2021. With LCD TV panel prices already falling rapidly, IT panel prices flattening, demand growth uncertain in 2022 and component shortages expected to ease next year, 2022 should increasingly become a buyer’s market. 2023 will depend on whether or not LGD takes more capacity offline or not. If it keeps all its LCD capacity online in 2023, the surplus will likely continue to widen. If it takes projected capacity offline, pricing will be stabilized with the potential to rise. The outlook for 2024 and 2025 currently shows less capacity growth at 6% - 7% which assumes BOE B17+ gets built as a G10.5 LCD fab. If BOE goes in a different direction such as acquiring a competitor or moving to G8.5 OLED for IT applications, it will create less pricing pressure. As prices come down in 2022 and beyond, we expect to see panel manufacturers increasingly shift their emphasis to miniLEDs which have significantly higher prices in order to keep their revenues up. The companies that are most successful in doing this likely have the best chance for outperformance. We have raised our outlook for 2020-2025 G7+ capacity growth from a 6.1% CAGR last quarter to a 7.4% CAGR this quarter as panel manufacturers respond to improved market conditions and record profits by expanding capacity and capex.
G7+ LCD and OLED Capacity Forecast
Other highlights from this report include:
- Total 2025 display capacity was upgraded by 5.1% vs. the previous issue due to 6 new LCD investments as manufacturers respond to tight supply, higher prices and higher profits with new capex. Total display capacity now risers at a 6.3% CAGR vs. 5.2% last quarter.
- Our 2020-2025 LCD capacity forecast now rises at a 5.1% CAGR vs. 3.9% last quarter. 2025 LCD capacity is now 6% higher than last quarter.
- Our 2020-2025 OLED capacity forecast was downgraded by 2% vs. our previous forecast due a number of delays and one cancellation. OLED capacity is now expected to grow at an 18.2% CAGR vs. 18.6% last quarter.
- LCD TVs will continue to dominate capacity and grow at a 6.3% CAGR from 2020 to 2025, up from 4.9% last quarter. The LCD TV capacity share will reach 73% from 2022 to 2024 before declining to 72% in 2025.
- OLED TVs are expected to enjoy the fastest growth, rising at a 28% CAGR, down from 31% last quarter on some delays, with its share rising from 2% in 2020 to 6% in 2025.
- Mobile OLEDs, which includes IT OLED fabs, are expected to grow at a 12% CAGR and rise from a 5% share in 2020 to a 6% share in 2025.
- We have seen some increase in rigid OLED capacity vs. last quarter with a number of panel manufacturers expected to adopt rigid substrates for IT applications using FMM VTE technology. The rigid OLED growth is now 10.1% vs. 2.3% CAGR previously. Flexible OLEDs are now expected to grow at a 13.4% CAGR vs. 14.6% CAGR previously and rise from a 36% share of mobile OLED capacity in 2020 to a 41% share in 2025, down from 46%.
- China is the only region experiencing capacity growth over the forecast, now rising at an 11.9% CAGR, up from 11.4% last quarter, with Korea down at a 10.4% CAGR and Japan, Singapore and Taiwan flat. China’s share is expected to rise from 53% in 2020 to 71% in 2025, up from 70%, Korea’s share is expected to fall from 19% to 8% while Taiwan’s share falls from 22% to 17%.
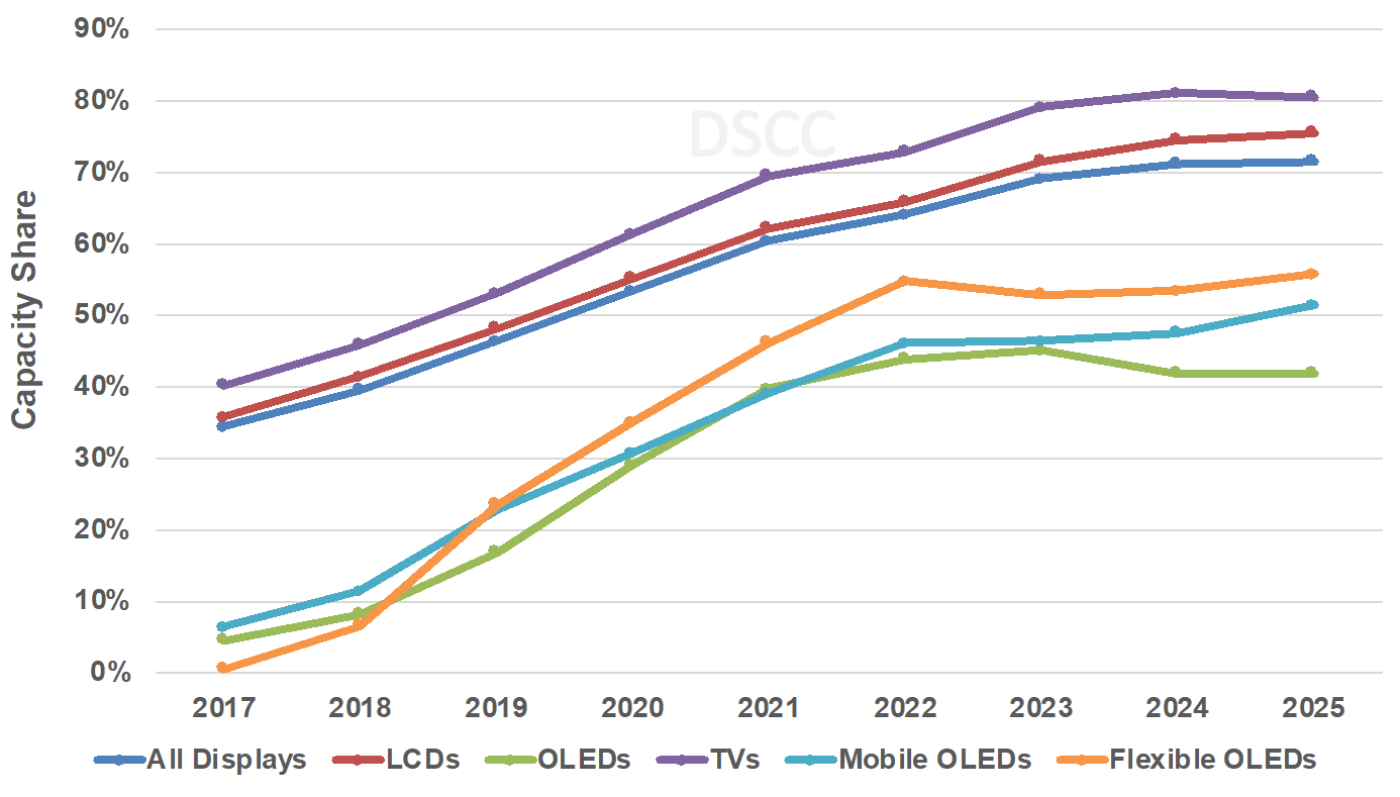
- China is projected to have at least a 42% share in all applications/technologies shown below from 2025. In terms of China’s share in 2025 vs. last quarter:
- 75% in LCDs, up from 74% last quarter.
- 42% in OLEDs vs. 49% last quarter due to delays/cancellations and growth in Korea.
- 81% in TVs, up from 80%.
- 51% in mobile OLEDs, down from 53%.
- 56% in flexible OLEDs, down from 60%.
China’s Capacity Share by Technology/Application
In terms of capacity share by panel supplier:
- Total Display Capacity
- BOE became the #1 display supplier on a capacity basis in 2019 with a 17.5% to 16.6% advantage over LGD. We expect BOE to widen its advantage on a 13% CAGR from 2020 to 2025, up from 11%, due to the inclusion of B17+ If it acquires CHOT as some expect, it will raise its share another 3 points.
- China Star is expected to become #2 in 2022 helped by its acquisition of SDC Suzhou and its new LCD and OLED fabs growing at an 17% CAGR, down from 18% last quarter. LGD is expected to fall from #1 in 2018 to #2 in 2019, #3 in 2022, #4 in 2023, #5 in 2024 and 2025.
- LCD Capacity
- BOE overtook LG Display for the #1 position in 2019 and is expected to widen its advantage on a 12% CAGR, up from 9%, on its new and expanded G10.5 fabs. Its LCD share is expected to reach 28% in 2025 from 20% in 2020. If it acquires CHOT, its LCD capacity share will exceed 30%.
- China Star is expected to rise to #2 from 2021 on a 13% CAGR with its share rising from 10% in 2020 to 17% in 2025.
- HKC is expected to have the fastest growth, rising at a 30% CAGR to rise from 5% in 2020 to a 13% share and the #3 position from 2022. In 2025, Innolux will be #4 followed by AUO, Sharp/SIO and then LGD.
- OLED Capacity
- SDC leads in total OLED capacity from 2016-2020 and is expected to be overtaken by LGD from 2021 who will lead through 2025. LGD is expected to outgrow SDC on 19% vs. 12% CAGR from 2020 to 2025, up from 17% and 11% last quarter on growth in mobile, IT and OLED TVs.
- BOE is expected to reach #3 from 2018 and its share is expected to rise from 9% in 2020 to 12% in 2025 on a 25% CAGR. China Star is expected to reach #4 from 2025 and account for a 6% share in 2025 on the fastest growth of 52% CAGR vs. 56% last quarter on T5 OLED delays. EDO, JOLED, Tianma and Visionox are also expected to grow at double-digits.
- Mobile OLED Capacity
- SDC will maintain a dominant position throughout the forecast, with its share not falling below 40% throughout. We now show a 4% CAGR from 2020-2025 vs. 1% last quarter on the planned G8.5 RGB OLED investments for IT. BOE overtook LGD for #2 in 2020 and is expected to maintain that spot throughout the forecast with its share rising to 23% in 2025 on a 25% CAGR. In 2025, Tianma is expected to be #3 followed by LGD, China Star, Visionox and EDO.
- Flexible OLED Capacity
- We show SDC holding onto its advantage with at least a 30% share throughout the forecast. BOE’s share rises to 26% in 2022 and then declines to 23% in 2025. LGD holds on to the #3 position throughout the forecast followed by Tianma from 2023. In 2025, China Star will be #5 followed by Visionox.
DSCC tracks display capacity by frontplane, backplane, substrate, substrate size, region, application, panel manufacturer and is available in pivot tables and a PDF report. For more information on DSCC’s capacity forecast or its Quarterly Display Capex and Equipment Market Share Report (一部実データ付きサンプルをお送りします), please contact info@displaysupplychain.co.jp.
About Counterpoint
https://www.displaysupplychain.co.jp/about
[一般のお客様:本記事の出典調査レポートのお引き合い]
上記「国内お問い合わせ窓口」にて承ります。会社名・部署名・お名前、および対象レポート名またはブログタイトルをお書き添えの上、メール送信をお願い申し上げます。和文概要資料、商品サンプル、国内販売価格を返信させていただきます。
[報道関係者様:本記事の日本語解説&データ入手のご要望]
上記「国内お問い合わせ窓口」にて承ります。媒体名・お名前・ご要望内容、および必要回答日時をお書き添えの上、メール送信をお願い申し上げます。記者様の締切時刻までに、国内アナリストが最大限・迅速にサポートさせていただきます。