国内お問い合わせ窓口
info@displaysupplychain.co.jp
FOR IMMEDIATE RELEASE: 06/07/2021
Q1 Panel Maker Revenues Hit All-Time Record
Bob O'Brien, Co-Founder, Principal AnalystAnn Arbor, MI USA -
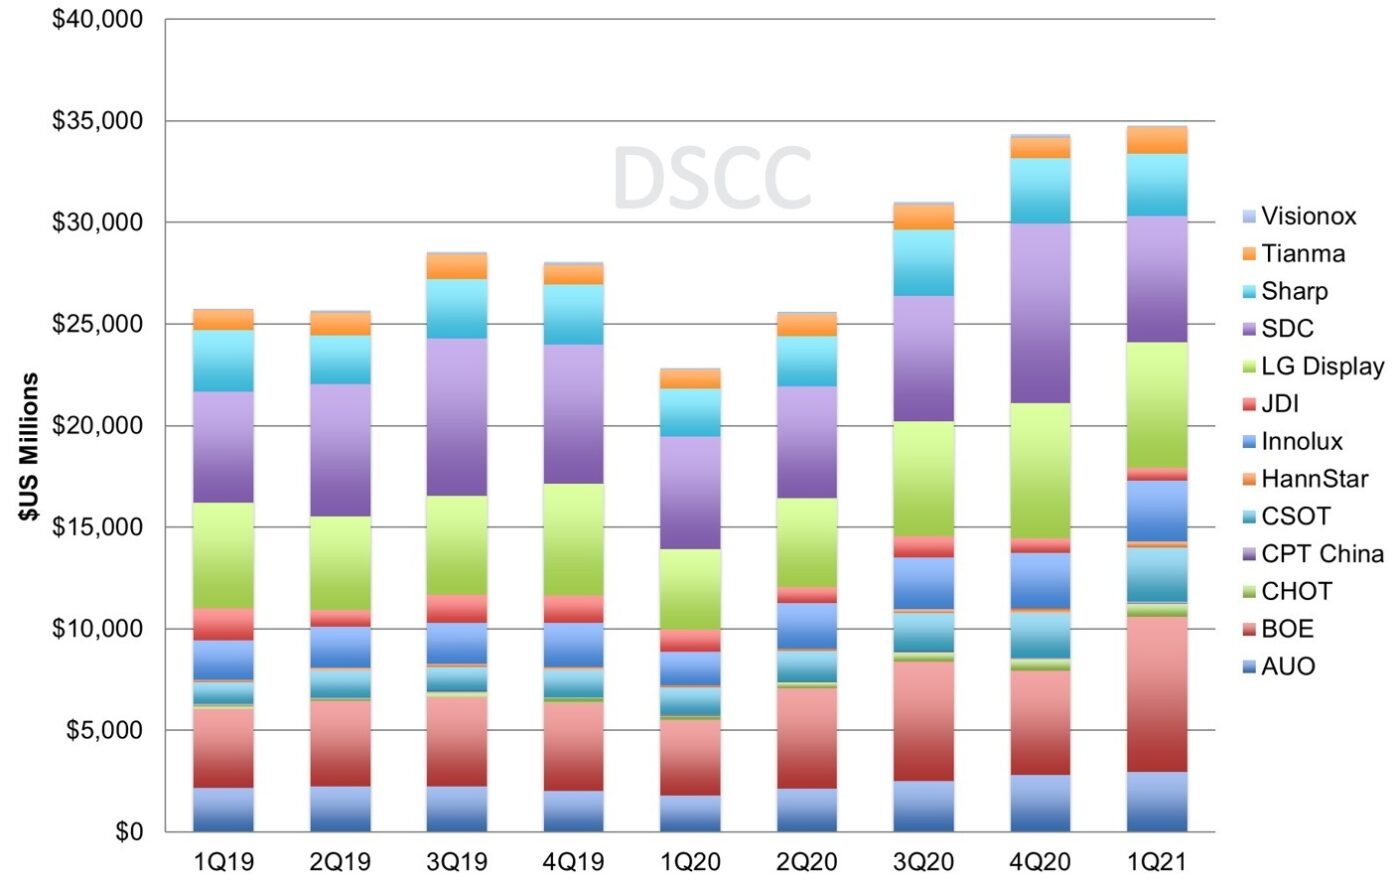
Flat panel display revenues increased 1% Q/Q and 52% Y/Y, to hit a record in Q1 2021 at $34.8B. With all panel makers reporting their Q1 2021 results, we can compile a full industry review for Q1, a terrific quarter for panel makers, especially those oriented toward large-area LCD panels.
The first chart in this section shows quarterly revenues for the 13 publicly traded panel makers. BOE passed Samsung for the top position in revenue share with Q1 revenues of $7.7B. BOE rode robust demand for large-area LCD to a 50% increase Q/Q in revenues while Samsung revenues decreased 29% Q/Q to $6.2B on the seasonal slowdown in smartphone panel sales. LGD is the only other company with a double-digit share, and LGD fell just short of Samsung for second place with revenues that rounded up to $6.2B. Then there is a cluster of four companies between 5% and 10% share: AUO, Innolux, CSOT and Sharp, each with revenues in the range of $2.7 - $3.1B.
Panel Maker Revenues, Q1 2019 to Q1 2021
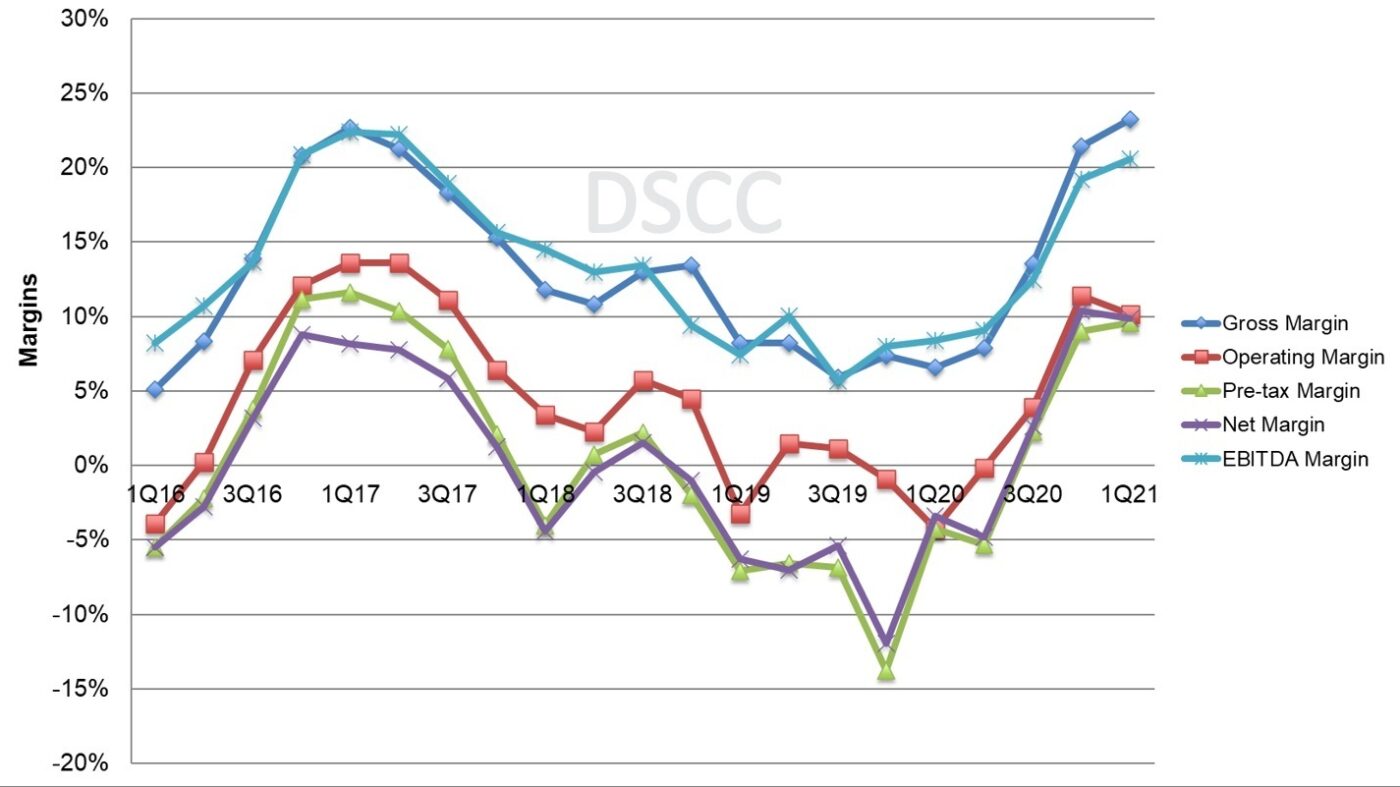
The effect of the Crystal Cycle is clearly shown on the next chart of industry margins. The increase in LCD panel prices for TVs and IT products has increased gross margins and EBITDA margins for four straight quarters. EBITDA margins are approaching the highest point of the previous Crystal Cycle peak in 2017, and gross margins exceeded the prior cycle peak by a small amount. Operating and net margins saw a small decrease Q/Q, but net margins remain higher than the prior Crystal Cycle peak at 10%.
Note that these margin figures exclude certain companies from certain metrics: for example, Samsung reports operating margin for its display business, but not pre-tax or net margin. Nevertheless, the series is consistent over time, clearly demonstrating the industry’s long descent from 2017-2019 and sharp recovery in 2020-2021.
Display Industry Margins, Q1 2016 to Q1 2021
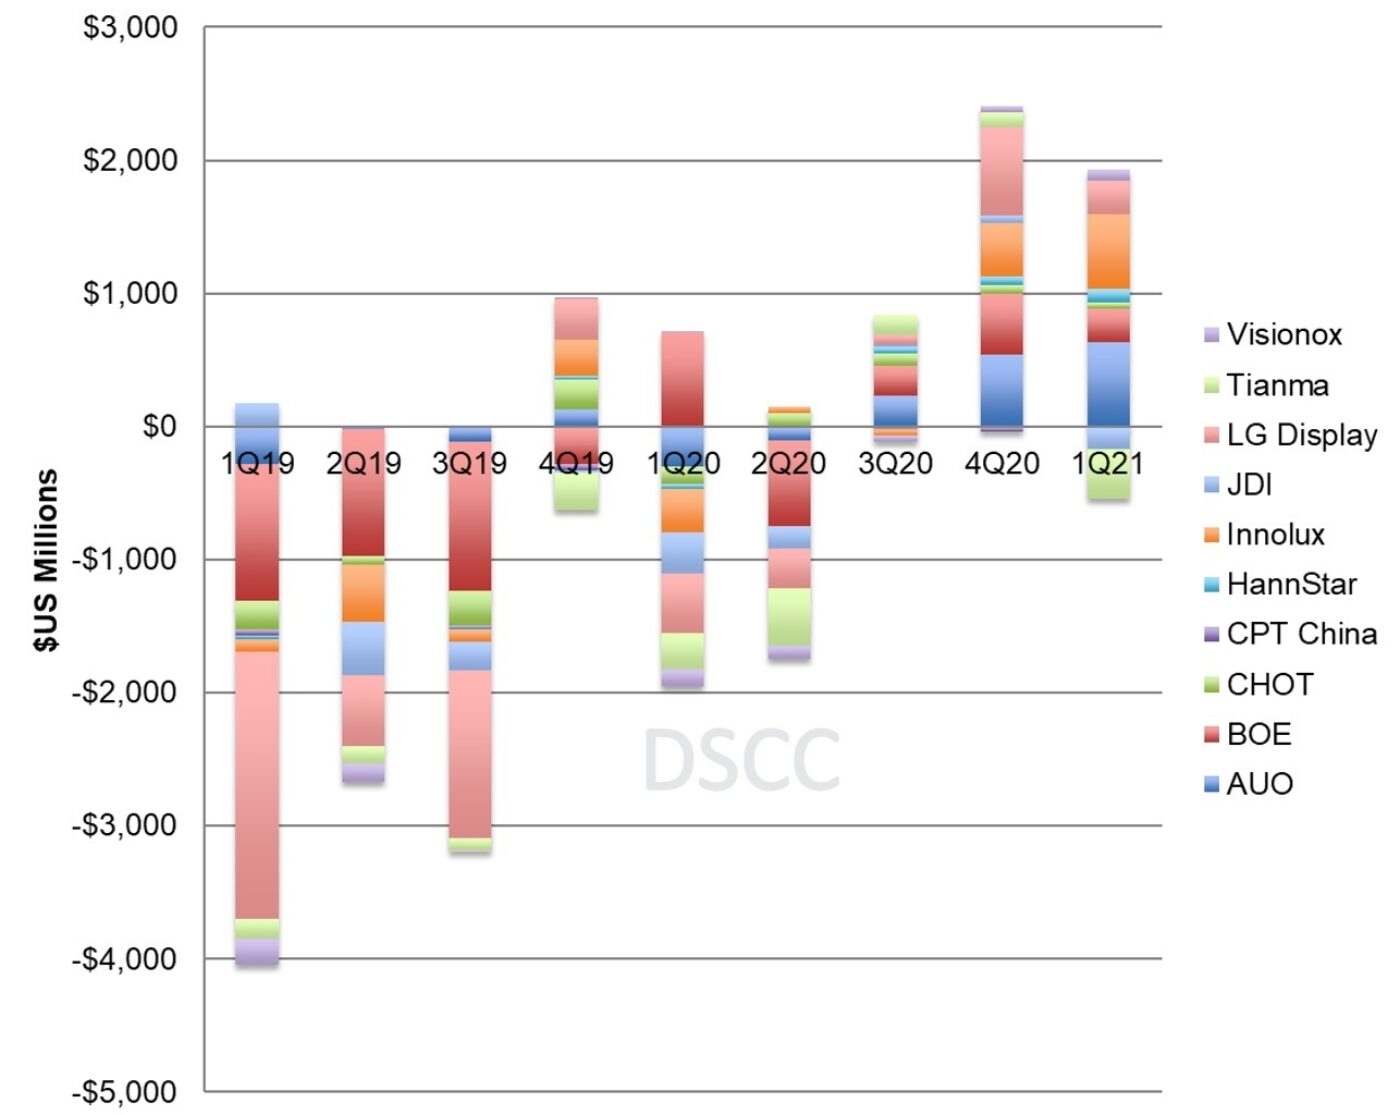
Display industry operating margins in recent years have been dominated by Samsung Display, but that dominance ended in Q1 2021 and BOE has taken the top spot. In Q4 2020, SDC’s operating profit of $1537M captured nearly 40% of the industry total, but in Q1 2021 SDC’s share of industry operating profits fell to less than 10% while BOE operating profits of $1.4B took 39% of industry profits. 10 of the 12 panel makers reported operating profits and eight companies reported operating profits greater than $100M for the quarter with only JDI and Visionox reporting losses. With SDC operating profits falling by $1.2B Q/Q, the total industry operating results decreased by 10% Q/Q but compared to a year ago when the industry in total recorded an operating loss of nearly $1B, operating profits improved by $4.5B Y/Y. Excluding SDC the industry operating profits increased 35% Q/Q.
Panel Maker Operating Results, Q1 2019 to Q1 2021
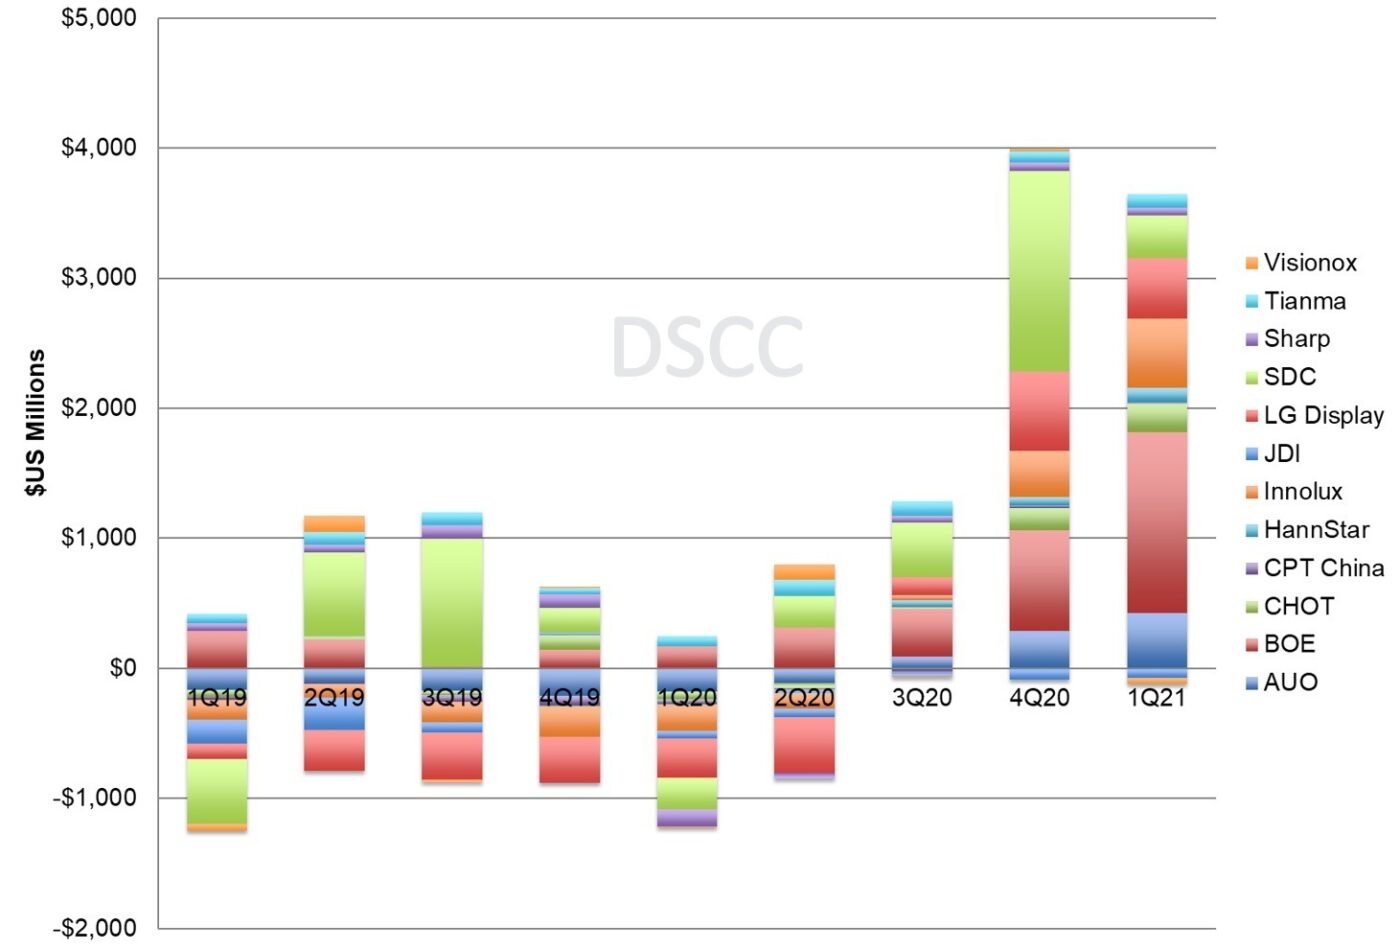
Net profit figures exclude Samsung and Sharp, which do not report net profits of their display businesses, but the rest of the display industry posted a net profit of $2.5B in Q1 2021, the highest total since at least 2013. BOE led the industry with a net profit of $972M.
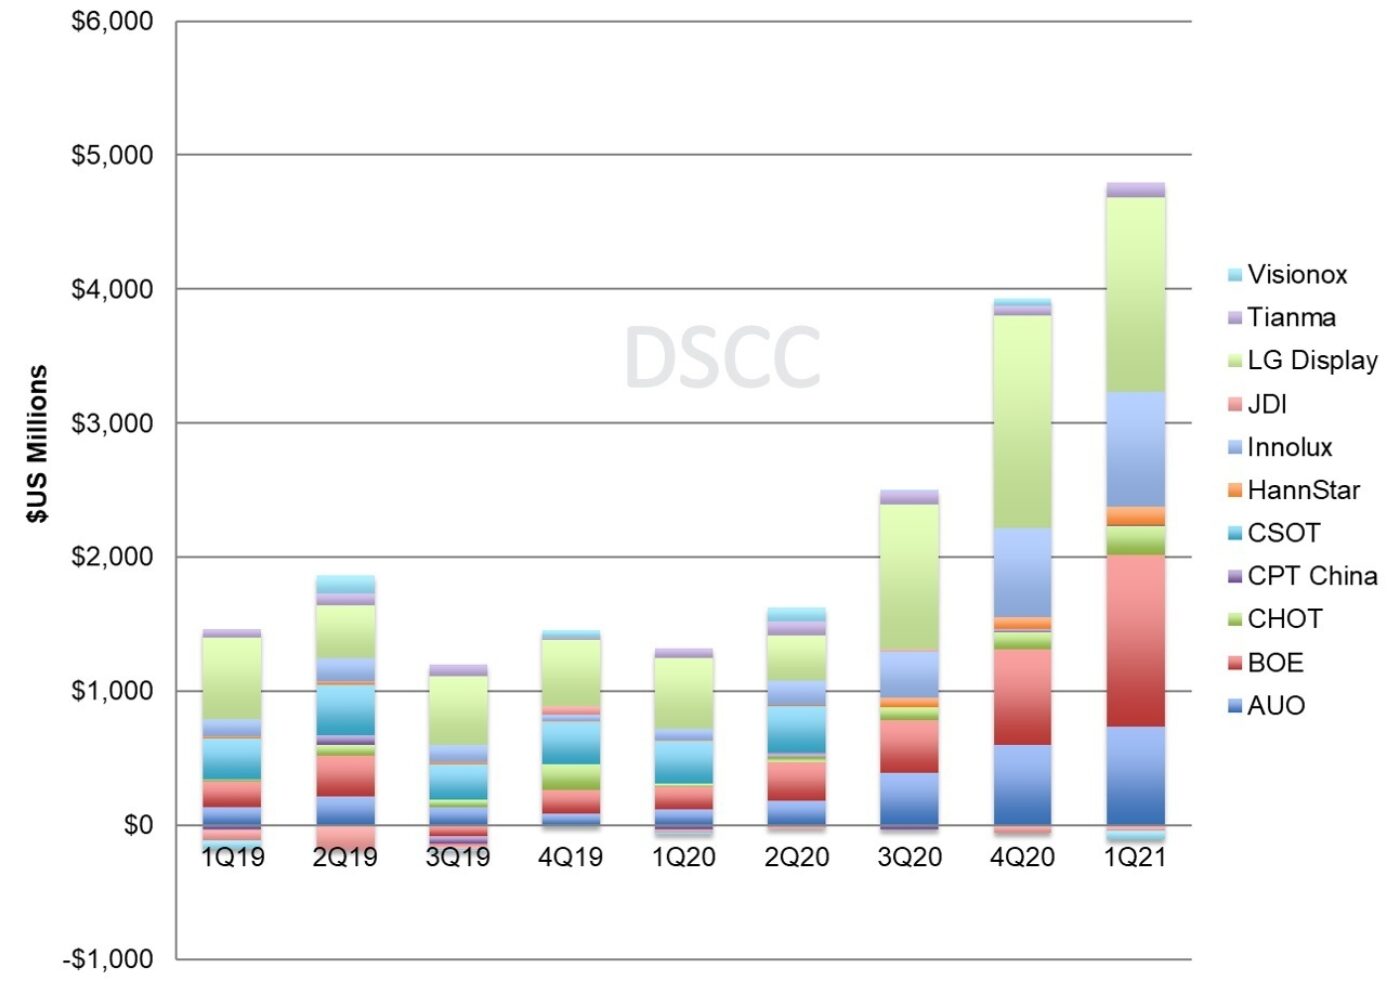
EBITDA by company is shown in the next chart, and EBITDA for the industry increased by 21% Q/Q and 274% Y/Y to $4.7B, the highest level since at least 2013 and likely the highest ever. All panel makers except JDI and Visionox posted positive EBITDA in Q1 2021. LGD took the top spot in EBITDA with $1453M in the quarter, with BOE not far behind at $1284M. EBITDA totals exclude Samsung, Sharp and CSOT, which do not report depreciation/amortization for their display businesses separately.
Panel Maker EBITDA, Q1 2019 to Q1 2021
Turning to company balance sheets, inventory increased in absolute value in Q1 but remained restrained or even tight in relation to the higher sales revenue. Inventory value increased by 7% Q/Q and 21% Y/Y, but with the increase in shipments inventory days decreased 32 at the end of Q4 2020 to 31 at the end of Q1.
Profits in the last several quarters have allowed several panel makers to reduce their debt burden, or at least to reduce debt/equity ratios by increasing equity. BOE’s debt/equity ratio was reduced from 110% at the end of Q3 2020 to 78% at the end of Q1 2021, and LGD trimmed their debt/equity from 118% to 108% and AUO improved debt/equity from 66% to 57% in the same time frame. With strong Q1 profits, most panel makers increased their cash positions, so net debt/equity ratios improved even further. LGD’s net debt/equity decreased from 90% at the end of Q3 2020 to 75% at the end of Q1 2020.
Historically, panel makers have been notorious for their miserable performance on free cash flow (FCF). In prior crystal cycles, periods of profit were typically accompanied by heavy capital investment, so FCF was minimal at the top of the crystal cycle and negative at the bottom. In 2018, industry FCF was a negative $7.2B, and the industry booked another $5.1B of negative FCF in 2019. Increasing profits in the second half of 2020 allowed the industry to reach positive FCF for the full year 2020 at +$1.0B. The industry reported its third consecutive quarter of positive free cash flow in Q1 2021 for the first time since at least 2015 with the Taiwan panel makers leading the way. AUO and Innolux each booked more than $500M in FCF in Q1, and even little HannStar booked more than $100M of FCF.
Panel Maker Free Cash Flow, Q1 2019 to Q1 2021
The increase in demand for flat panels for both IT and TV, and the corresponding increase in panel prices, has lifted the fortunes of panel makers across the industry, but the companies which have benefitted most have concentrated on LCD panels for large-area applications. This includes the Taiwan panel makers but also CHOT, BOE and CSOT in China. LG Display’s emphasis on OLED has hindered its results, and companies focused on smaller screens such as JDI, Tianma and Visionox have not seen improvement compared to pre-pandemic results. With LCD panel prices continuing to increase in Q2 2021, we expect the strong results to continue.
本記事の出典調査レポート
Quarterly Display Supply Chain Financial Health Report
一部実データ付きサンプルをご返送
ご案内手順
1) まずは「お問い合わせフォーム」経由のご要請にて「国内販売価格」を24時間以内にご返信します。 2) 続いて、レポート最新号に基づく「商品サンプル」を作成の上、ご返信します。 3) さらに、ご希望されるお客様には、DSCCアジア代表・田村喜男アナリストによる「本レポートの強み~DSCC独自の分析手法とは」のご説明 (お電話またはWEB面談) の上、お客様のミッションやお悩みをお聞かせください。本レポートを主候補に、課題解決に向けた最適サービスをご提案させていただきます。 4) ご購入後も、掲載内容に関するご質問を国内お客様サポート窓口が承り、質疑応答ミーティングを通じた国内外アナリスト/コンサルタントとの積極的な交流をお手伝いします。
About Counterpoint
https://www.displaysupplychain.co.jp/about
[一般のお客様:本記事の出典調査レポートのお引き合い]
上記「国内お問い合わせ窓口」にて承ります。会社名・部署名・お名前、および対象レポート名またはブログタイトルをお書き添えの上、メール送信をお願い申し上げます。和文概要資料、商品サンプル、国内販売価格を返信させていただきます。
[報道関係者様:本記事の日本語解説&データ入手のご要望]
上記「国内お問い合わせ窓口」にて承ります。媒体名・お名前・ご要望内容、および必要回答日時をお書き添えの上、メール送信をお願い申し上げます。記者様の締切時刻までに、国内アナリストが最大限・迅速にサポートさせていただきます。