国内お問い合わせ窓口
info@displaysupplychain.co.jp
FOR IMMEDIATE RELEASE: 10/25/2021
Display Fab Utilization Expected to Slow as Prices Plunge
Bob O'Brien, Co-Founder, Principal AnalystAnn Arbor, MI USA -
With LCD panel prices falling at the fastest rates ever, display industry fab utilization is expected to slow down in the fourth quarter of 2021, according to the latest release of DSCC’s Quarterly All Display Fab Utilization Report (一部実データ付きサンプルをお送りします), issued this week. In Q3 2021, total TFT input for all display makers was up 3% Q/Q and 12% Y/Y at 87.3M square meters, and in the current Q4 2021, we expect total TFT input to be down 3% Q/Q but still up 7% Y/Y at 85.1M square meters.
The report details capacity, TFT input and utilization for every flat panel display fab in the industry, more than 100 fabs in all, and includes pivot tables to allow segmentation by supplier, country, TFT fab generation, backplane, frontplane or substrate type. The report provides historical utilization back to Q1 2018 and a forecast by month for through the first quarter of 2022.
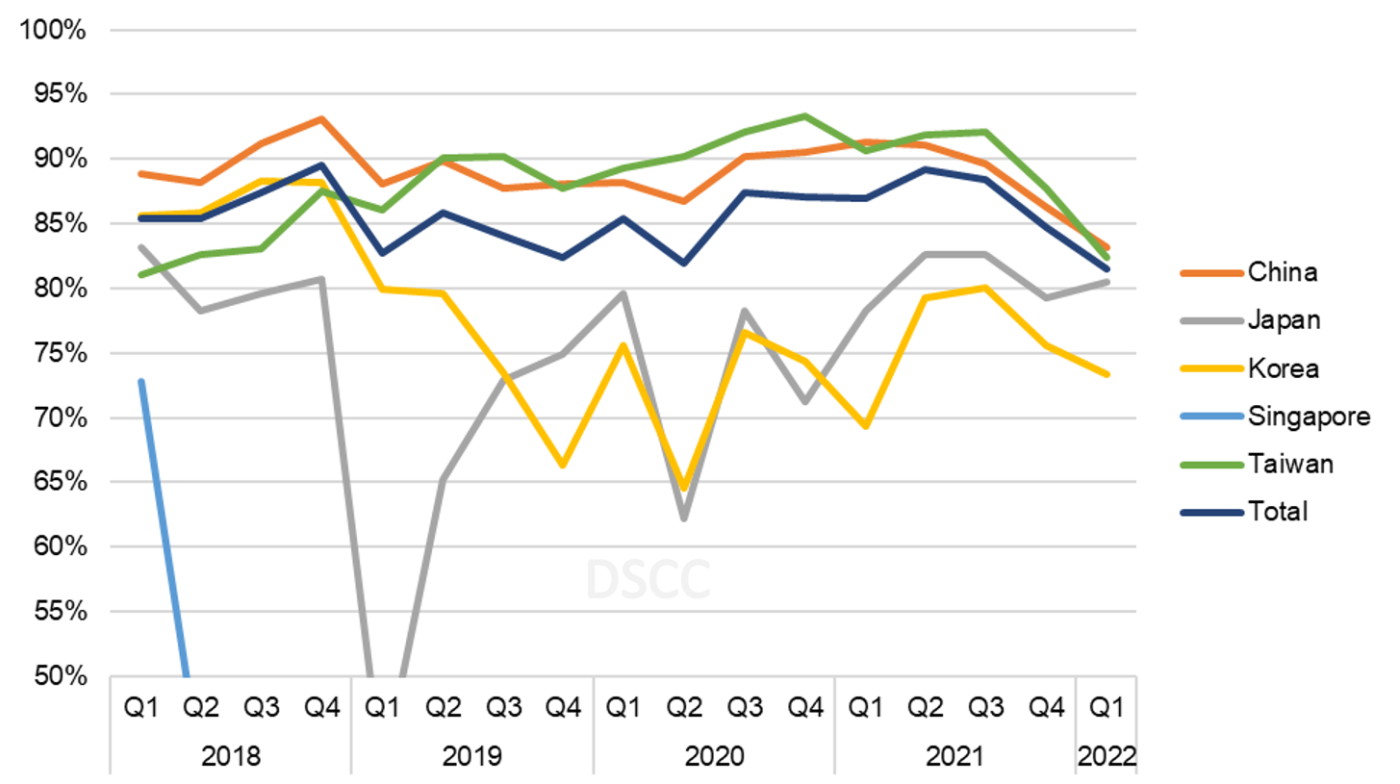
During the full year of rising LCD panel prices from Q2 2020 to Q2 2021, fab utilization was particularly strong in Taiwan and China, as shown in the first chart here. This continued in Q3, with only slight reductions as prices fell, and utilization in Taiwan remained above 90% for the sixth straight quarter in Q3 2021. Worldwide utilization in Q3 2021 dropped slightly from 90% in Q2 2021 to 89% in Q3.
As shown in the chart, we expect a slowdown in Q4 and Q1 with utilization falling in each quarter in most regions. The electricity shortage in China may help the slowdown by constraining supply, but the electricity shortage is not the main reason for the slowdown. Instead, the slowdown is mostly about LCD panel prices. A slowdown in worldwide utilization to 85% in Q4 2021 will not be sufficient to stabilize prices, so a further slowdown in Q1 2022 will be required. We expect worldwide utilization of 82% in Q1.
TFT Quarterly Fab Utilization by Region, 2018-2022
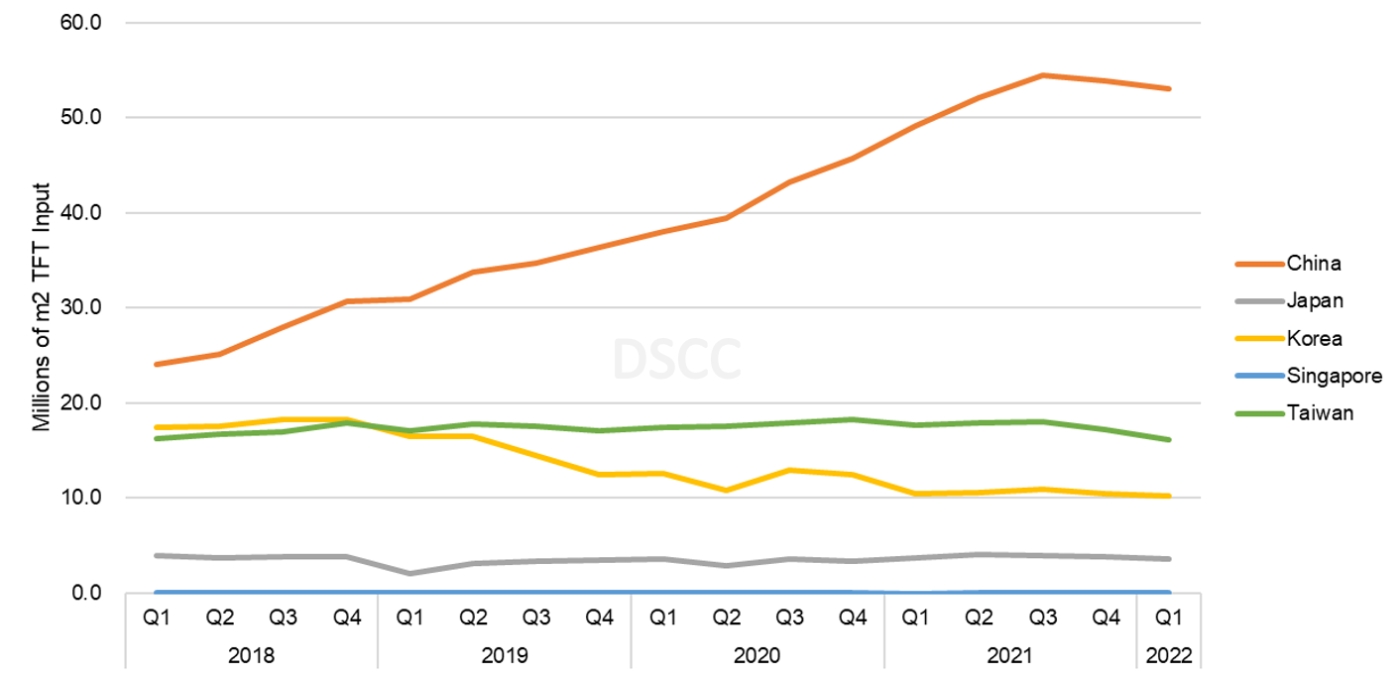
A view of TFT input shows the extent that China has taken over the industry in the last three years and how this process has continued in 2021. Given the size of China in the flat panel display industry, the slowdown must happen there. In Q1 2018, China represented 39% of total industry TFT input on an area basis, but by Q3 of 2019, China was larger than all other regions combined. By the first quarter of 2022, China will represent 64% of all industry TFT input.
Quarterly TFT Input by Region, 2018-2022
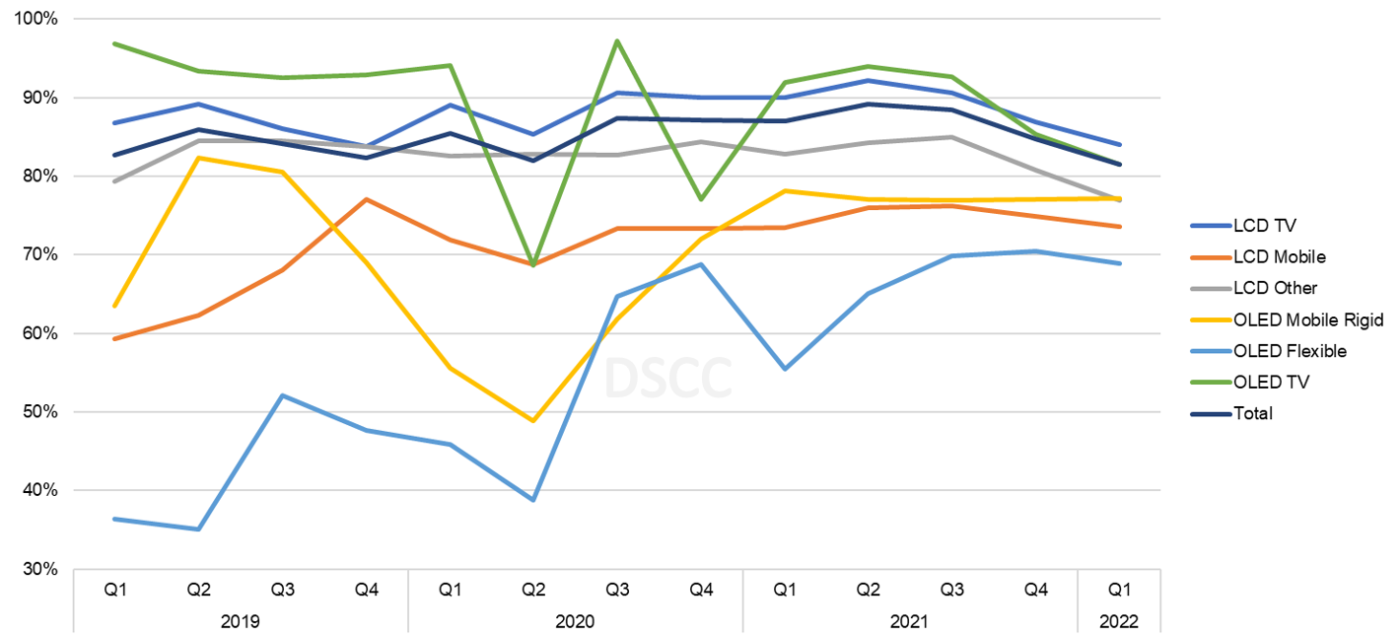
Looking at the picture by main application and display technology, we see that mobile OLED fabs are consistently run at much lower utilization than LCD fabs. The lower UT% largely drives this at Samsung’s flexible OLED lines, but BOE’s flexible OLED lines have also run at very low UT% since 2H’20 after its biggest customer, Huawei, got hit with US sanctions.
In contrast, LGD’s OLED TV lines have returned to becoming the highest UT% in the industry for any application. After some stumbles in 2020, LGD started to ramp capacity in their Gen 8.5 fab in Guangzhou, China. With strong sales of OLED TVs and the introduction of new products like 48” and 83” OLED TV, LGD ran its OLED TV lines at nearly full capacity through Q3 2021 but is expected to slow down in Q4/Q1 to support prices.
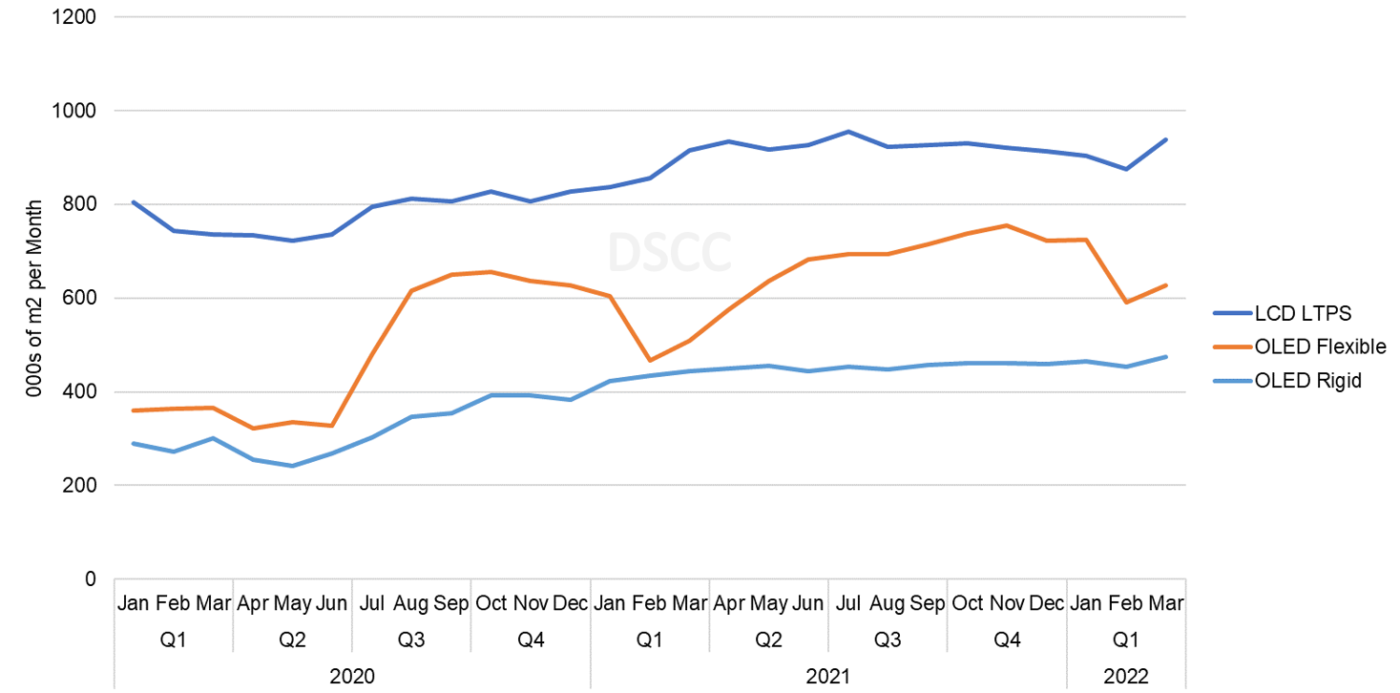
UT% for flexible OLED has followed a consistent pattern in recent years, with utilization low in the first half and much higher in the second half. That pattern has continued in 2021 and is expected to persist in 2022, with a general trend of higher utilization each year. Utilization of rigid lines fell in 2020 compared to 2019 but recovered in 2021 with more aggressive pricing of rigid OLED panels.
Quarterly TFT Utilization by Display Technology, 2019-2022
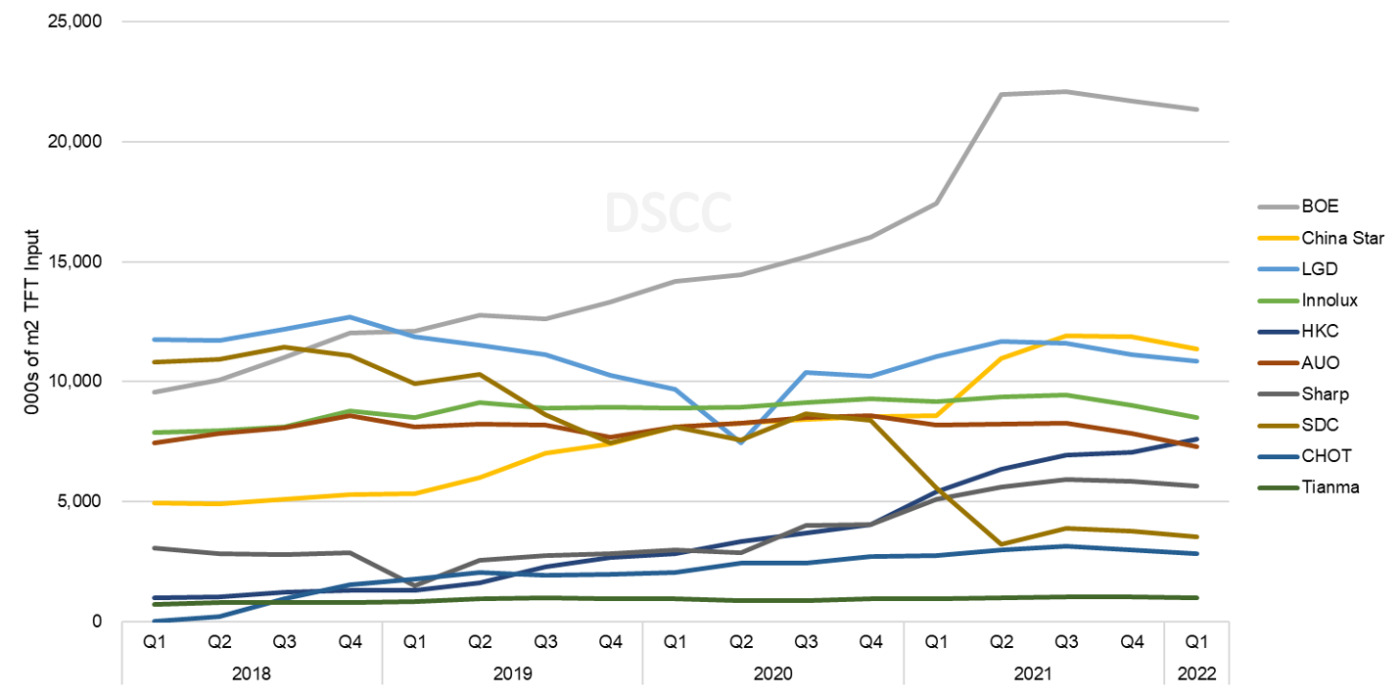
A view of TFT input by panel maker shows the increasing dominance of BOE. Starting in Q1 2021, we count BOE’s Gen 8.5/8.6 fabs newly acquired from CEC Panda in their total. Similarly, starting from Q2 2021, we count the Gen 8.5 fab in Suzhou, China as capacity and input for China Star after they acquired this fab from SDC. In Q1 2022, we expect that BOE will represent 26% of industry TFT input, with China Star another 14%.
With LCD TV panel prices spiking during the pandemic, LGD delayed its plans to shut down LCD capacity in Korea, and LGD maintained a high utilization on its Korea lines through Q3 2021. The delayed shutdown allowed LGD to hold onto the #2 position in TFT input ahead of China Star for the first half of 2021, but capacity increases at China Star helped it to pass LGD in Q3 2021. In contrast to LGD, Samsung has slowed down utilization on its remaining LCD lines in Korea, and with the loss of China’s capacity, Samsung has fallen to #8 in TFT input.
Quarterly TFT Input by Panel Maker, 2018-2022
In addition to DSCC’s Quarterly All Display Fab Utilization Report which covers capacity, TFT Input and utilization by month for every flat panel display fab in the industry, DSCC offers a more focused report for smaller applications. DSCC’s Quarterly OLED and Mobile LCD Fab Utilization Report covers the same subjects for all OLED fabs and all LTPS LCD fabs. Just as the All Display report includes pivot tables to allow segmentation by supplier, country, TFT fab generation, backplane, frontplane or substrate type.
A chart from the Quarterly OLED and Mobile LCD Fab Utilization Report shows the growth of OLED in the smartphone and mobile IT industry. Flexible OLED lines show a consistent seasonal slowdown in the first half and a strong second half driven by iPhone demand, but also show consistent Y/Y growth. Flexible OLED TFT input is expected to increase by 36% for the full year 2021. While rigid OLED does not have the same seasonal pattern, its growth is even stronger in 2021 at 42%.
Quarterly TFT Input by Frontplane and Substrate, 2018-2022
Both DSCC’s Quarterly All Display Fab Utilization Report and DSCC’s Quarterly OLED and Mobile LCD Fab Utilization Report provide historical utilization back to Q1 2018 and a forecast by month through the first three months of 2021. DSCC Weekly readers interested in subscribing to these reports should contact info@displaysupplychain.co.jp.
本記事の出典調査レポート
Quarterly All Display Fab Utilization Report
一部実データ付きサンプルをご返送
ご案内手順
1) まずは「お問い合わせフォーム」経由のご連絡にて、ご紹介資料、国内販売価格、一部実データ付きサンプルをご返信します。2) その後、DSCCアジア代表・田村喜男アナリストによる「本レポートの強み~DSCC独自の分析手法とは」のご説明 (お電話またはWEB面談) の上、お客様のミッションやお悩みをお聞かせください。本レポートを主候補に、課題解決に向けた最適サービスをご提案させていただきます。 3) ご購入後も、掲載内容に関するご質問を国内お客様サポート窓口が承り、質疑応答ミーティングを通じた国内外アナリスト/コンサルタントとの積極的な交流をお手伝いします。
About Counterpoint
https://www.displaysupplychain.co.jp/about
[一般のお客様:本記事の出典調査レポートのお引き合い]
上記「国内お問い合わせ窓口」にて承ります。会社名・部署名・お名前、および対象レポート名またはブログタイトルをお書き添えの上、メール送信をお願い申し上げます。和文概要資料、商品サンプル、国内販売価格を返信させていただきます。
[報道関係者様:本記事の日本語解説&データ入手のご要望]
上記「国内お問い合わせ窓口」にて承ります。媒体名・お名前・ご要望内容、および必要回答日時をお書き添えの上、メール送信をお願い申し上げます。記者様の締切時刻までに、国内アナリストが最大限・迅速にサポートさせていただきます。