国内お問い合わせ窓口
info@displaysupplychain.co.jp
FOR IMMEDIATE RELEASE: 09/07/2021
Q2 2021 Was the Best Quarter Ever for Flat Panel Display Makers
Bob O'Brien, Co-Founder, Principal AnalystAnn Arbor, MI USA -
Driven by robust pandemic-fed demand and supply shortages that led to increased prices, flat panel display makers had their best quarter in the history of the display industry in Q2 2021. With all panel makers reporting their Q2 2021 results, we can compile a full industry review for Q2, unquestionably the best quarter ever for panel makers, especially those oriented toward large-area LCD panels.
The list of best-ever financial indicators runs throughout nearly every financial indicator:
- Most flat panel display revenues in a quarter: $37.8B;
- Highest gross margins: 29%;
- Highest EBITDA margins: 30%;
- Highest net margins: 14%;
- Most operating profits for display businesses: $6.0B;
- Most EBITDA: $7.5B;
- Most net profits in a quarter: $4.0B;
- Highest operating cash flow: $7.1B;
- Highest positive free cash flow: $4.1B.
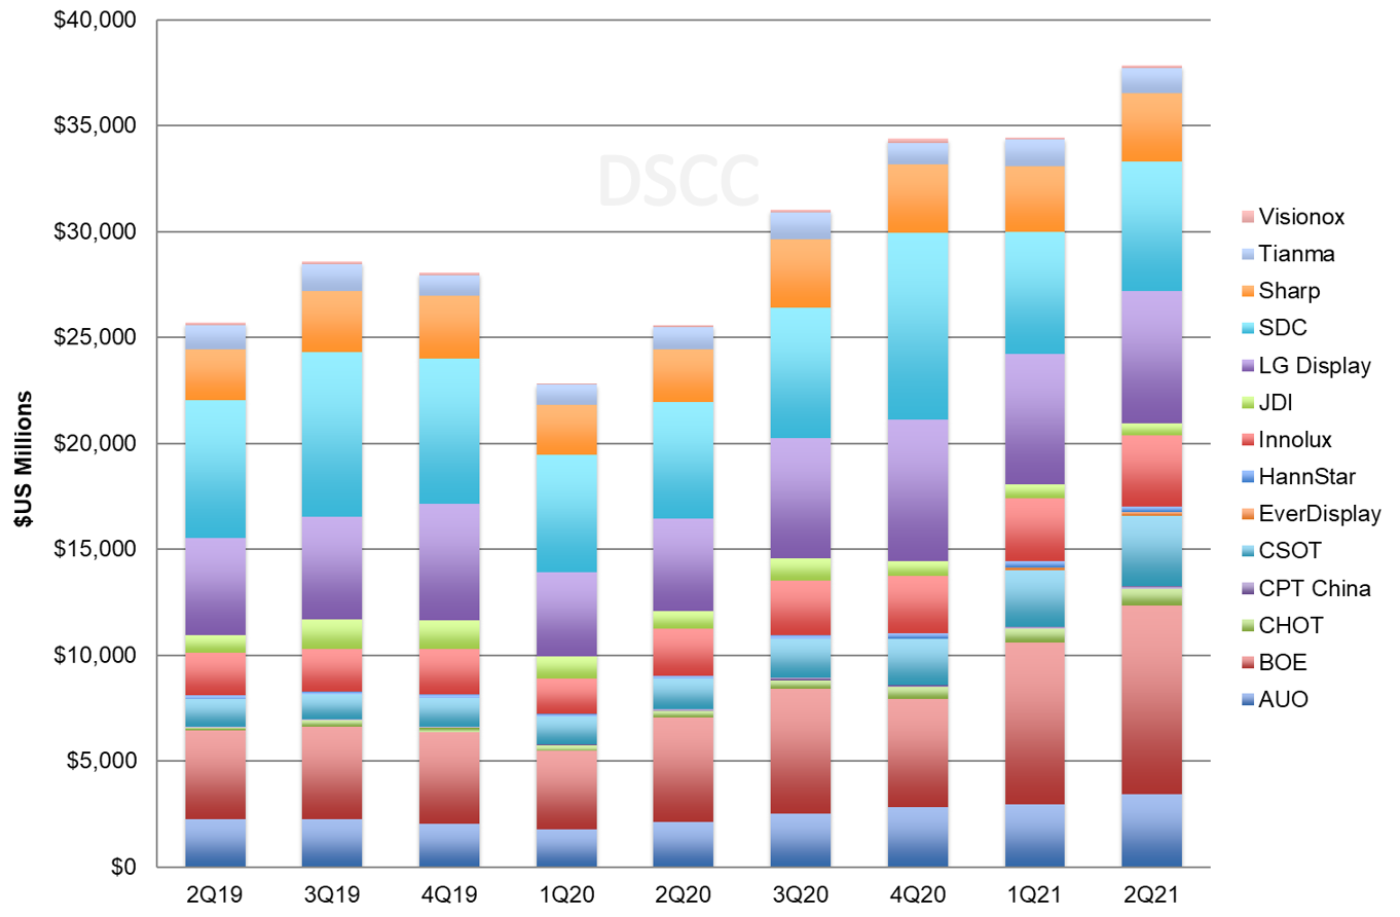
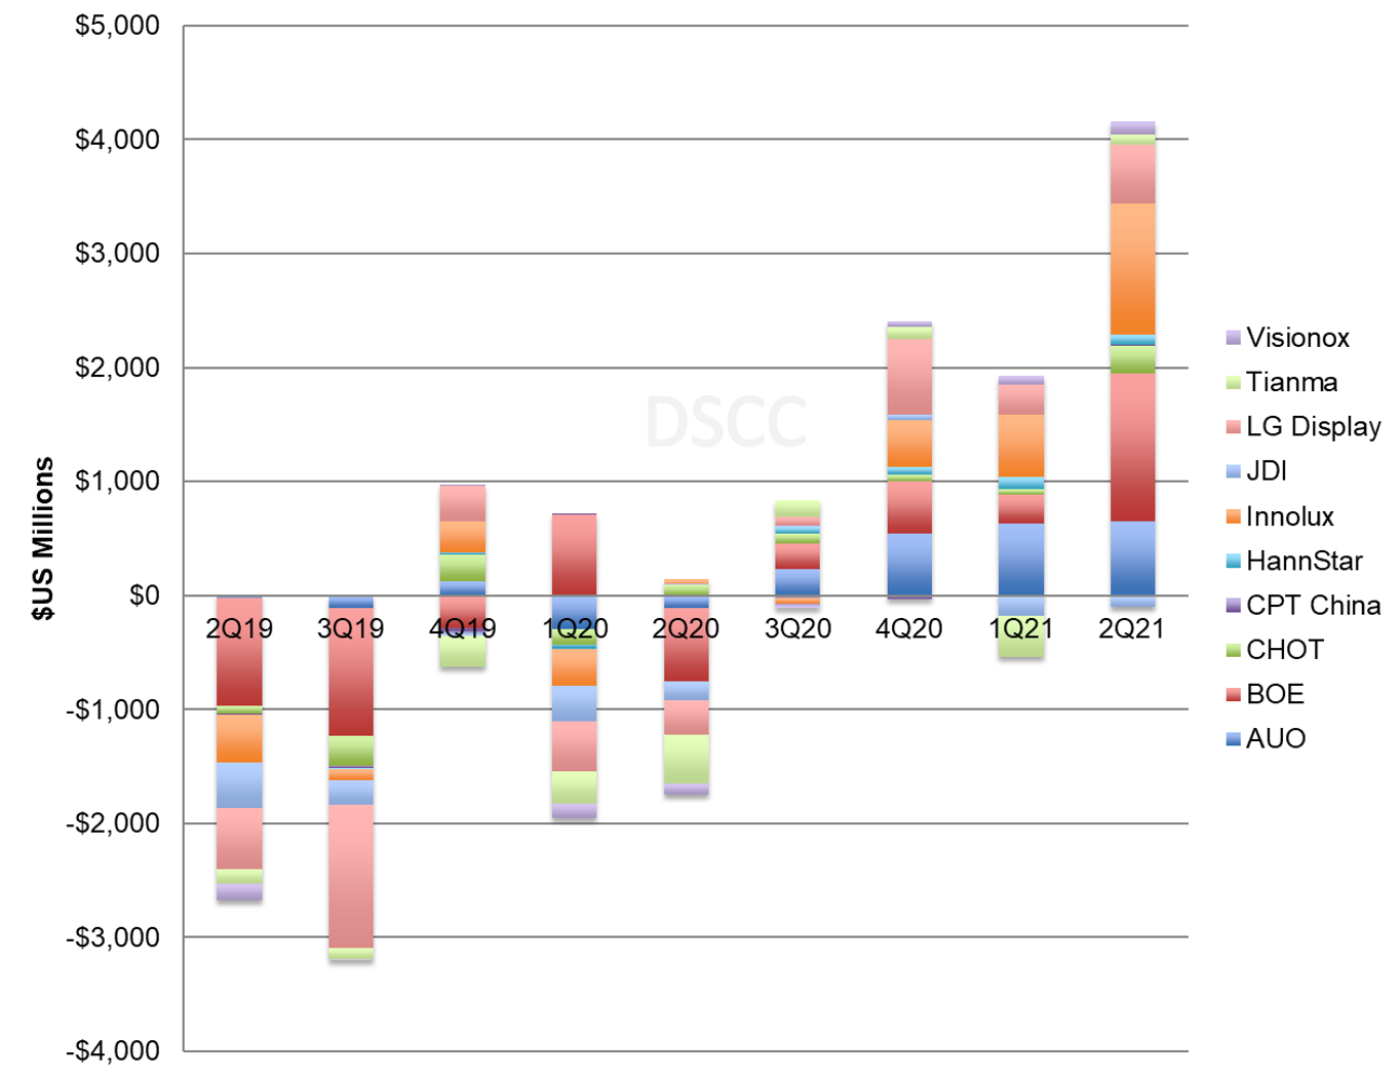
The first chart in this section shows quarterly revenues for the 14 publicly traded panel makers. Total revenues increased by 10% Q/Q and by 48% Y/Y to $37.8B. Starting in Q1 2021, BOE passed Samsung and LGD for the top position in revenue share and increased its lead in Q2 with revenues of $8.9B. Both Samsung and LGD increased revenues Q/Q but each company’s overall share decreased as their increases were less than the market. The two Korean giants remain #2 and #3 in revenue share, each with 16% as the only other companies with a double-digit share. Then there is a cluster of four companies between 8% and 9% share: AUO, Innolux, CSOT and Sharp, each with revenues in the range of $3.2B - $3.4B.
Flat Panel Display Maker Revenues, Q2 2019 to Q2 2021
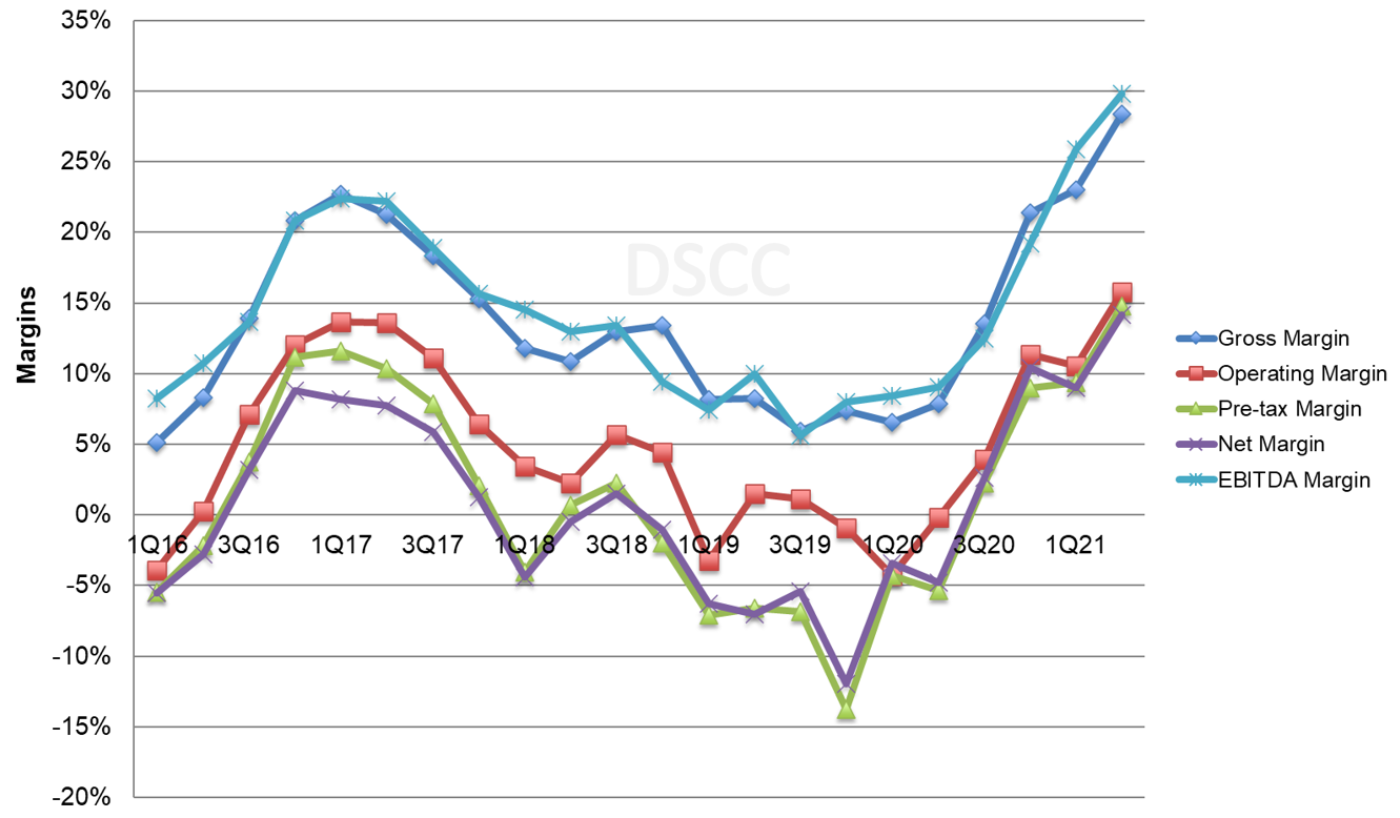
The effect of the Crystal Cycle is clearly shown on the next chart of industry margins. The increase in LCD panel prices for TVs and IT products has increased gross margins and EBITDA margins for five straight quarters, and these margins have exceeded the prior cycle peak. Operating and net margins also increased to their highest points ever. Among individual panel makers, CHOT notched a milestone in Q2 2021 with an EBITDA margin higher than 50% driven by high prices and low costs for LCD TV panels.
Note that these margin figures exclude certain companies from certain metrics: for example, Samsung reports operating margin for its display business, but not pre-tax or net margin. Nevertheless, the series is consistent over time, clearly demonstrating the industry’s long descent from 2017-2019 and sharp recovery in 2020-2021.
Display Industry Margins, Q1 2016 to Q2 2021
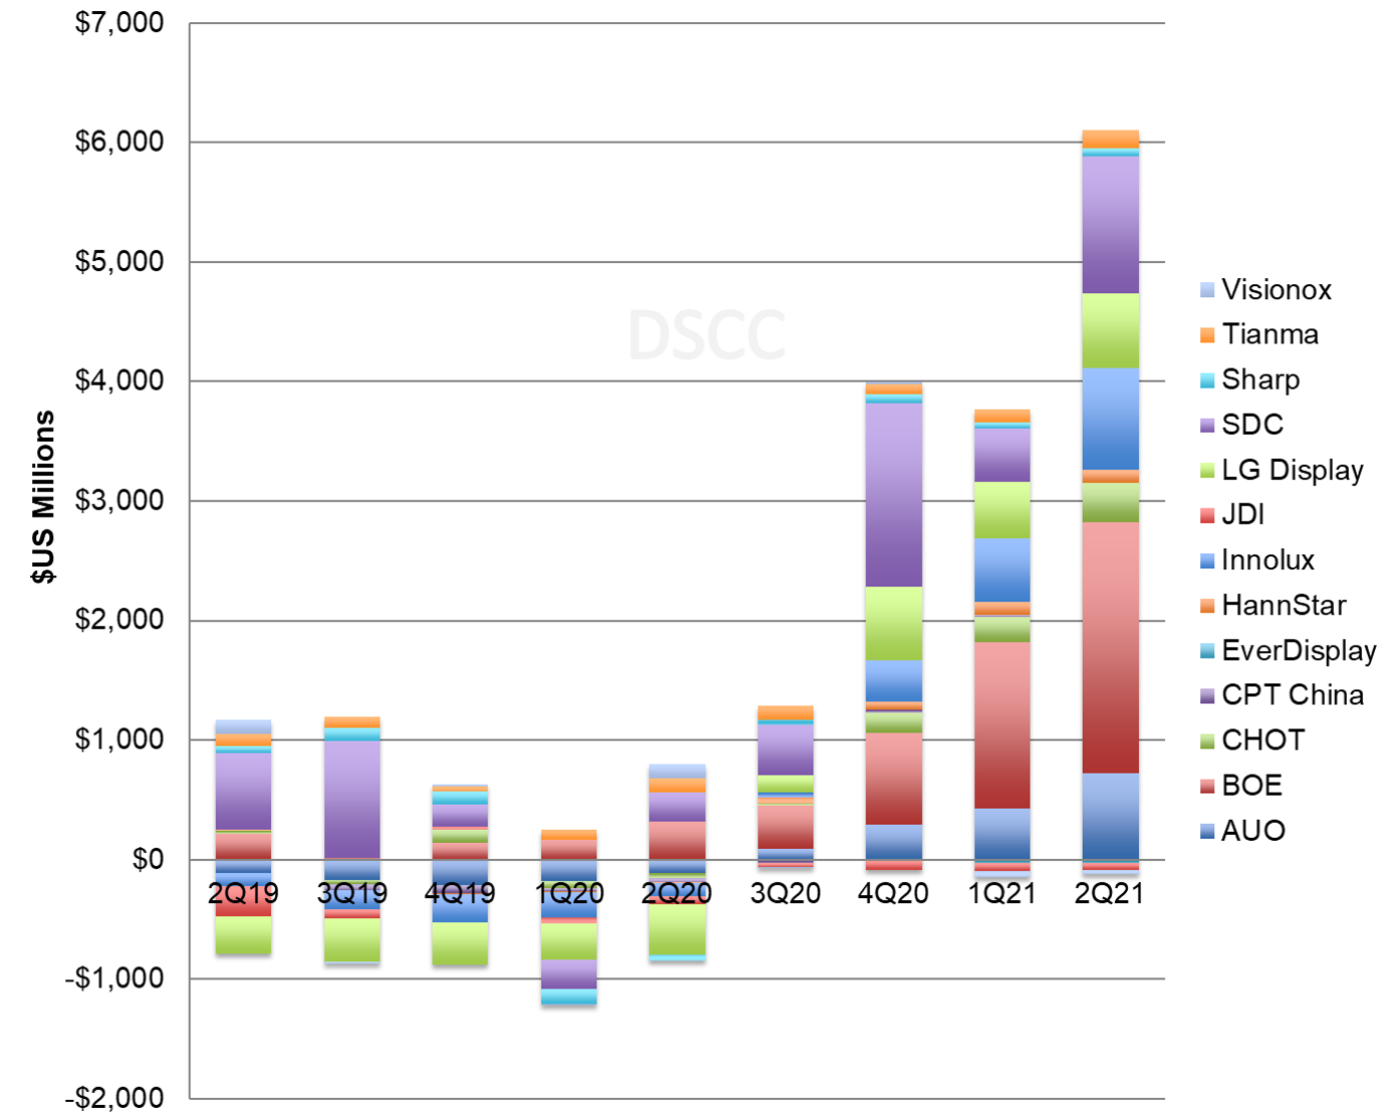
Display industry operating margins in 2018-2020 were dominated by Samsung Display, but that dominance ended in Q1 2021 and BOE has taken the top spot. In Q4 2020, SDC’s operating profit of $1537M captured nearly 40% of the industry total, but by Q2 2021 SDC’s share of industry operating profits remained less than 20% while BOE operating profits of $2.1B took 35% of industry profits. Nine of the 13 panel makers reported operating profits and eight companies reported operating profits greater than $100M for the quarter. The companies performing poorly were all focused on smaller panels and/or OLED: CPT China, EverDisplay, JDI and Visionox. The total industry operating results increased by 65% Q/Q and compared to a year ago when the industry in total recorded an operating loss, operating profits improved by more than $6B Y/Y.
Panel Maker Operating Results, Q2 2019 to Q2 2021
Net profit figures exclude Samsung and Sharp, which do not report net profits of their display businesses, but the rest of the display industry posted a net profit of $4.0B in Q2 2021, the highest total ever. BOE led the industry with a net profit of $1.2B, followed by Innolux, AUO and CSOT.
EBITDA by company is shown in the next chart, and EBITDA for the industry increased by 26% Q/Q and 371% Y/Y to $7.5B, the highest level ever. All panel makers except JDI and Visionox posted positive EBITDA in Q2 2021. BOE surpassed LGD for the top spot in EBITDA with $3.0B in the quarter, but LGD, Innolux and AUO each recorded more than $1B in EBITDA. EBITDA totals exclude Samsung, Sharp and CSOT, which do not report depreciation/amortization for their display businesses separately.
Panel Maker EBITDA, Q2 2019 to Q2 2021
Turning to company balance sheets, we see the first warning that Q2 2021 represented the industry peak. While panel maker inventories were constrained by tight supply in the second half of 2021, inventories have been increasing since Q4 2020 and many panel makers increased inventories in Q2 2021, a sign that the industry was no longer supply constrained.
Total industry inventory value increased by 20% Q/Q and 46% Y/Y, but with the increase in shipments, inventory days were up only three days Q/Q to 34 days.
Profits in the last several quarters have allowed several panel makers to reduce their debt burden, or at least to reduce debt/equity ratios by increasing equity. BOE’s debt/equity ratio was reduced from 110% at the end of Q3 2020 to 74% at the end of Q2 2021, and LGD trimmed their debt/equity from 118% to 100% and AUO improved debt/equity from 66% to 47% in the same time frame. With strong Q2 profits, most panel makers increased their cash positions, so net debt/equity ratios improved even further. LGD’s net debt/equity decreased from 90% at the end of Q3 2020 to 69% at the end of Q2 2021.
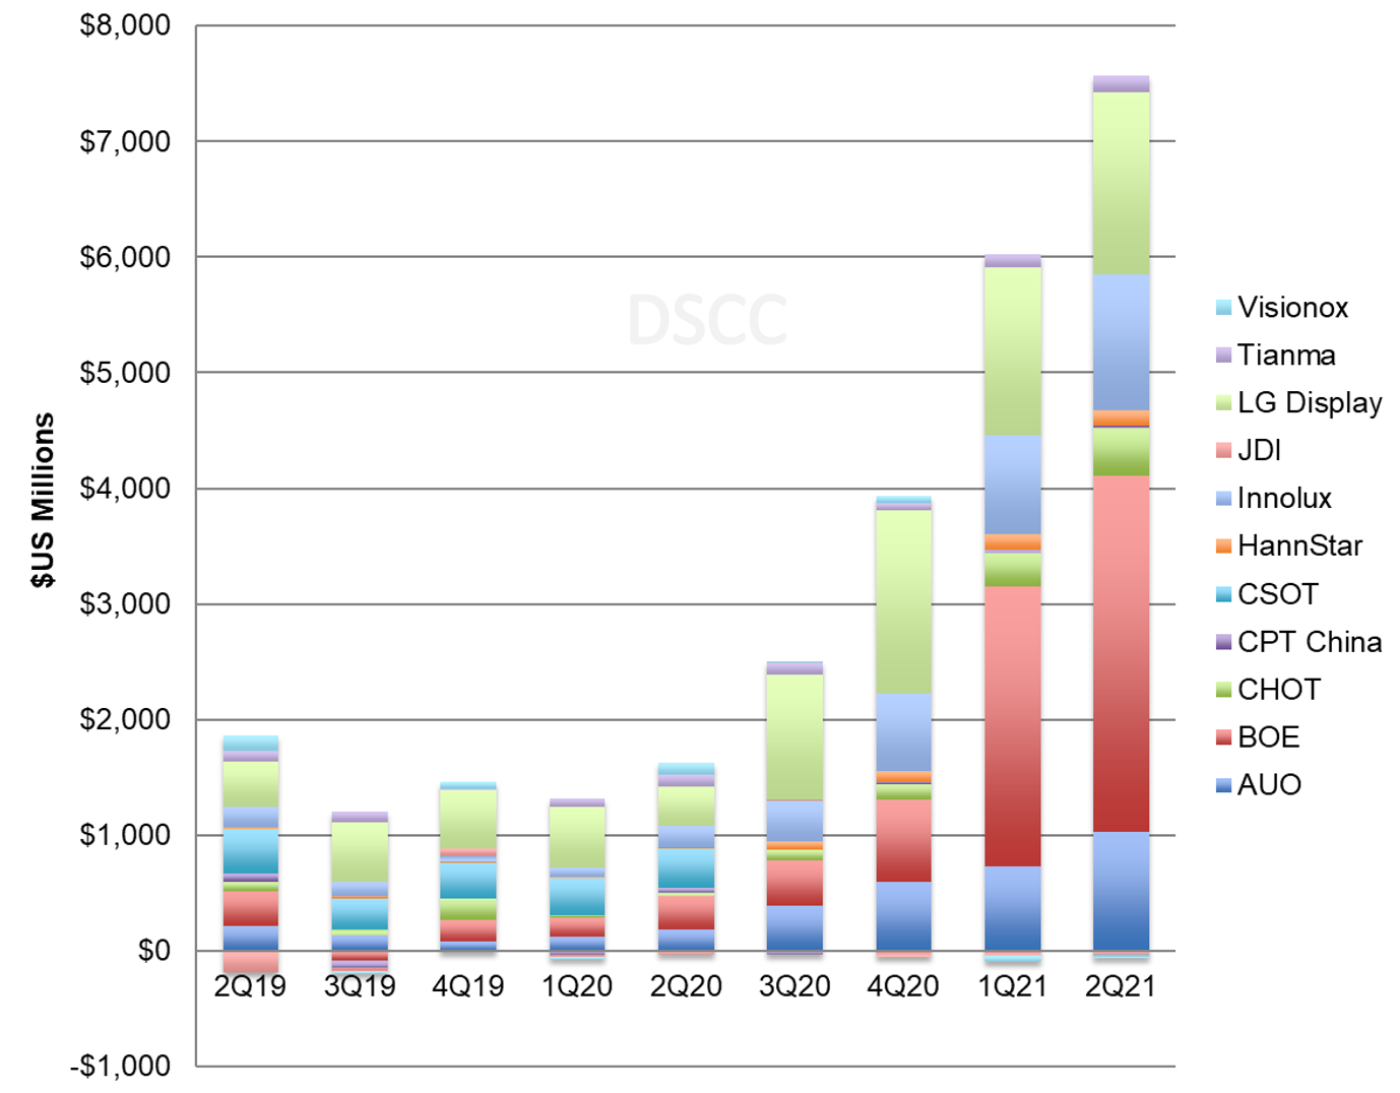
Historically, panel makers have been notorious for their miserable performance on free cash flow (FCF). In prior Crystal Cycles, periods of profit were typically accompanied by heavy capital investment, so FCF was minimal at the top of the Crystal Cycle and negative at the bottom. In 2018, industry FCF was a negative $7.2B, and the industry booked another $5.1B of negative FCF in 2019. Increasing profits in the second half of 2020 allowed the industry to reach positive FCF for the full year 2020 at +$1.0B. The industry reported its fourth consecutive quarter of positive free cash flow in Q2 2021 for the first time since at least 2015, and the highest level of free cash flow ever. BOE and Innolux each booked more than $1 billion in FCF in Q2, and both AUO and LGD booked more than $500M of FCF. Only newcomer EverDisplay and troubled JDI failed to record positive free cash flow.
Panel Maker Free Cash Flow, Q2 2019 to Q2 2021
About Counterpoint
https://www.displaysupplychain.co.jp/about
[一般のお客様:本記事の出典調査レポートのお引き合い]
上記「国内お問い合わせ窓口」にて承ります。会社名・部署名・お名前、および対象レポート名またはブログタイトルをお書き添えの上、メール送信をお願い申し上げます。和文概要資料、商品サンプル、国内販売価格を返信させていただきます。
[報道関係者様:本記事の日本語解説&データ入手のご要望]
上記「国内お問い合わせ窓口」にて承ります。媒体名・お名前・ご要望内容、および必要回答日時をお書き添えの上、メール送信をお願い申し上げます。記者様の締切時刻までに、国内アナリストが最大限・迅速にサポートさせていただきます。