国内お問い合わせ窓口
info@displaysupplychain.co.jp
FOR IMMEDIATE RELEASE: 03/22/2021
Display Fab Utilization Continuing Strong in 1H 2021
Bob O'Brien, Co-Founder, Principal AnalystAnn Arbor, MI USA -
With LCD panel prices at multi-year highs and spot shortages in some display applications, display industry fab utilization is continuing at high levels in the first half of 2021, according to the latest release of DSCC’s Quarterly All Display Fab Utilization Report (一部実データ付きサンプルをお送りします), issued this week. In Q4 2020, total TFT input for all display makers was up 3% Q/Q and 15% Y/Y at 79.4M square meters, and in the current Q1 2021, we expect total TFT input to be flat Q/Q but up 12% Y/Y at 79.6M square meters.
The report details capacity, TFT input, and utilization for every flat panel display fab in the industry, more than 100 fabs in all, and includes pivot tables to allow segmentation by the supplier, country, TFT fab generation, backplane, frontplane or substrate type. The report provides historical utilization back to Q1 2018 and a forecast by month for the first six months of 2021.
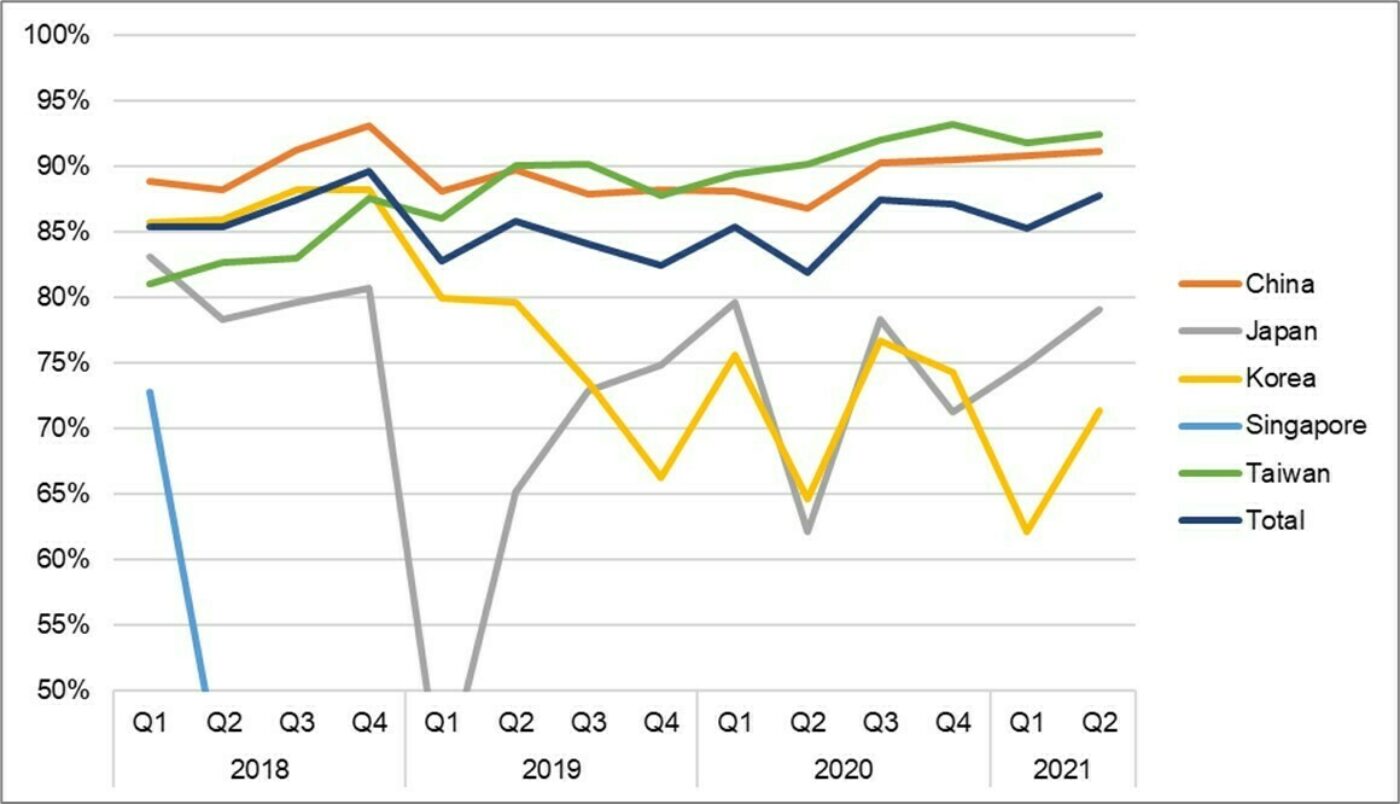
After a COVID-19 induced slowdown in the first half of 2020, fab utilization has been particularly strong in Taiwan and China, as shown in the first chart here. Although utilizations in Taiwan have decreased slightly in Q1, they are expected to remain above 90% for the fifth straight quarter in Q2 2021. Worldwide utilization in Q2 2021 is expected to hit 88%, its highest level since Q4 2018.
TFT Monthly Fab Utilization by Region, 2018-2021
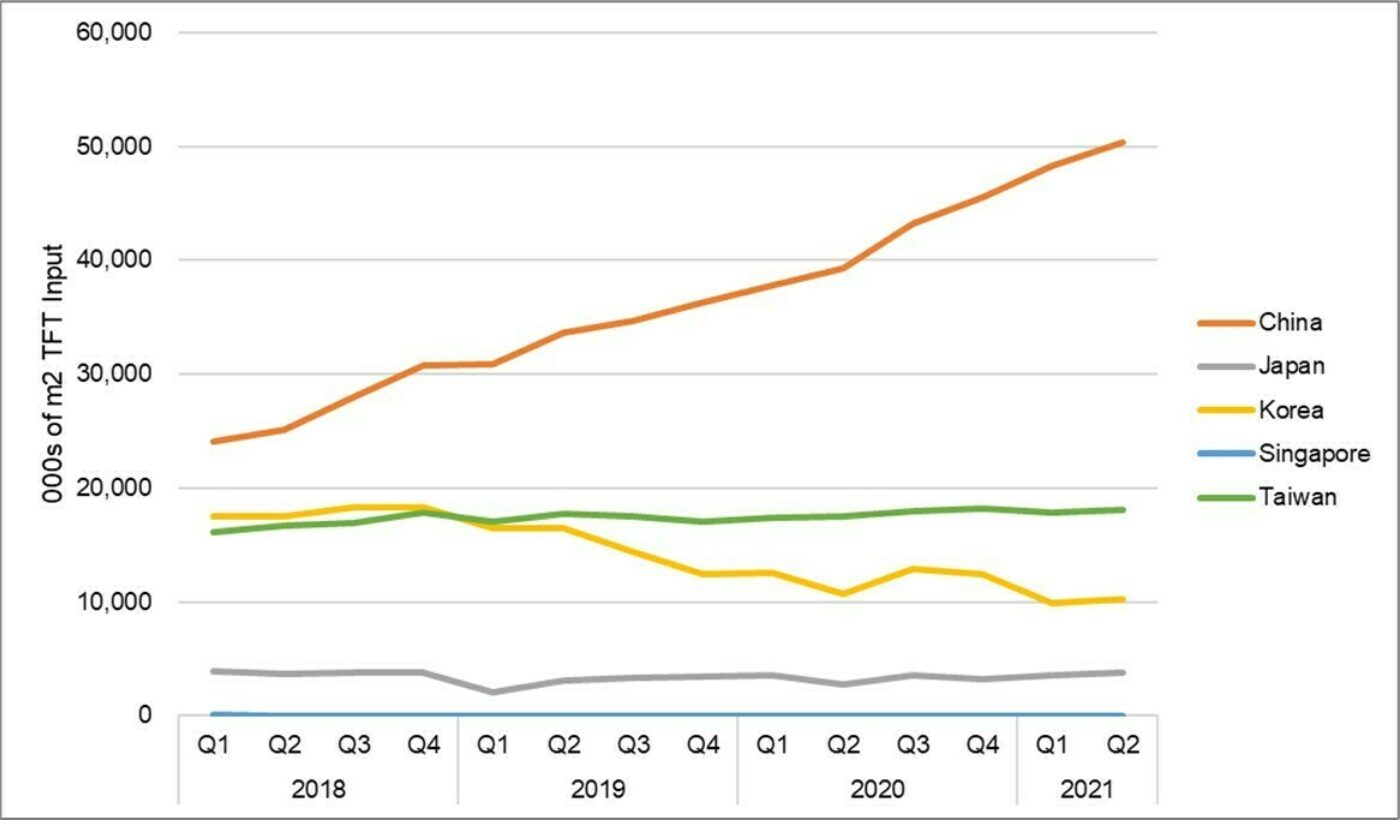
A view of TFT input shows the extent that China has taken over the industry in just the last two years and how this process is continuing in 2021. In Q1 2018, China represented 39% of total industry TFT input on an area basis, but by Q3 of 2019, China was larger than all other regions combined. By the second quarter of this year, China will be 61% of all industry TFT input.
Quarterly TFT Input by Region, 2018-2021
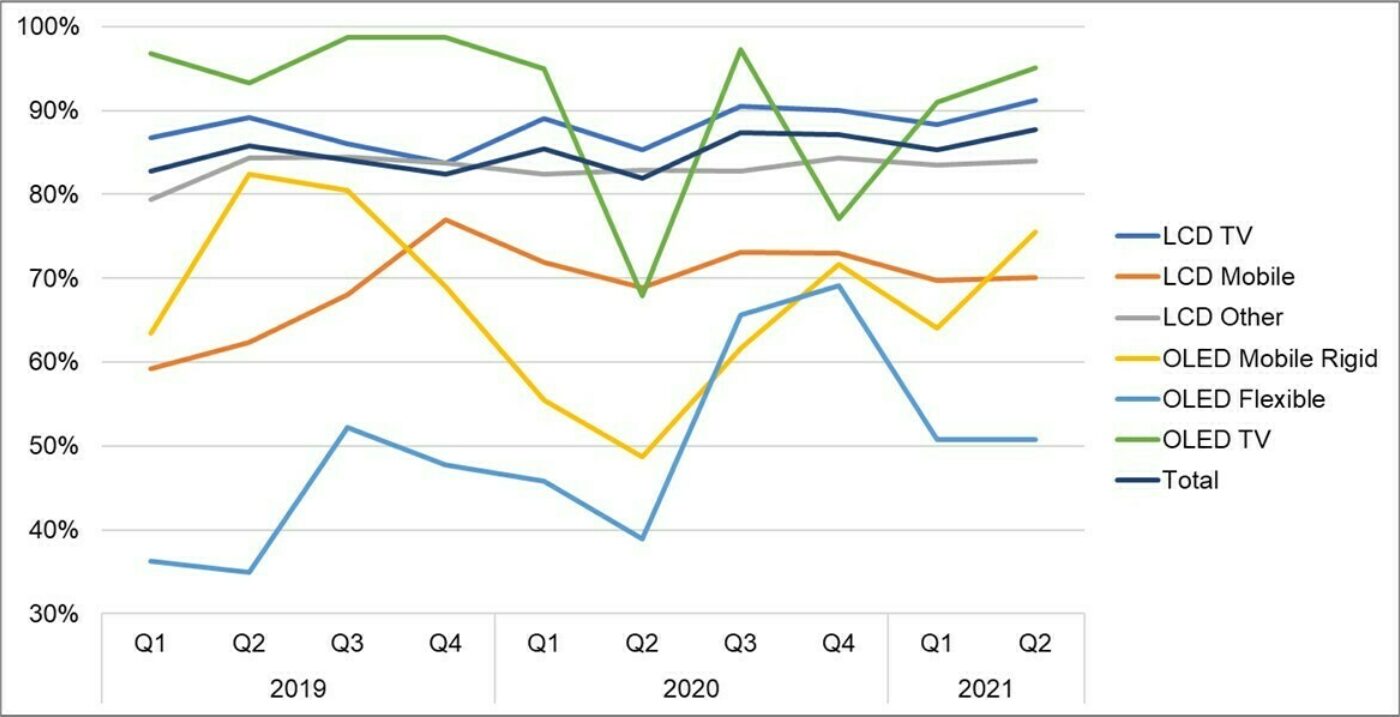
Looking at the picture by main application and display technology, we see that mobile OLED fabs are consistently run at much lower utilization than LCD fabs. This is largely driven by the low UT% at Samsung’s flexible OLED lines, but BOE’s flexible OLED lines have also run at very low UT% in 2020 and 2021.
In contrast, LGD’s OLED TV lines have returned to becoming the highest UT% in the industry for any application, after some stumbles in 2020 as LGD started to ramp capacity in their Gen 8.5 fab in Guangzhou, China. With strong sales of OLED TVs in Q4 2020 and the introduction of new products like 48” and 83” OLED TV, LGD is again running its OLED TV lines at nearly full capacity.
UT% for flexible OLED has followed a consistent pattern in recent years, with utilization low in the first half and much higher in the second half. In 2020, Apple’s product launch was delayed compared to prior years, so demand for flexible OLED panels peaked in Q4. Flexible utilization has dropped again in Q1 2021 on a seasonal downturn, but levels are higher on a Y/Y basis as the demand for flexible OLED panels continues to increase. Utilization of rigid lines fell in 2020 compared to 2019 but has recovered in the first half of 2021 with more aggressive pricing of rigid OLED panels.
Quarterly TFT Utilization by Display Technology, 2019-2021
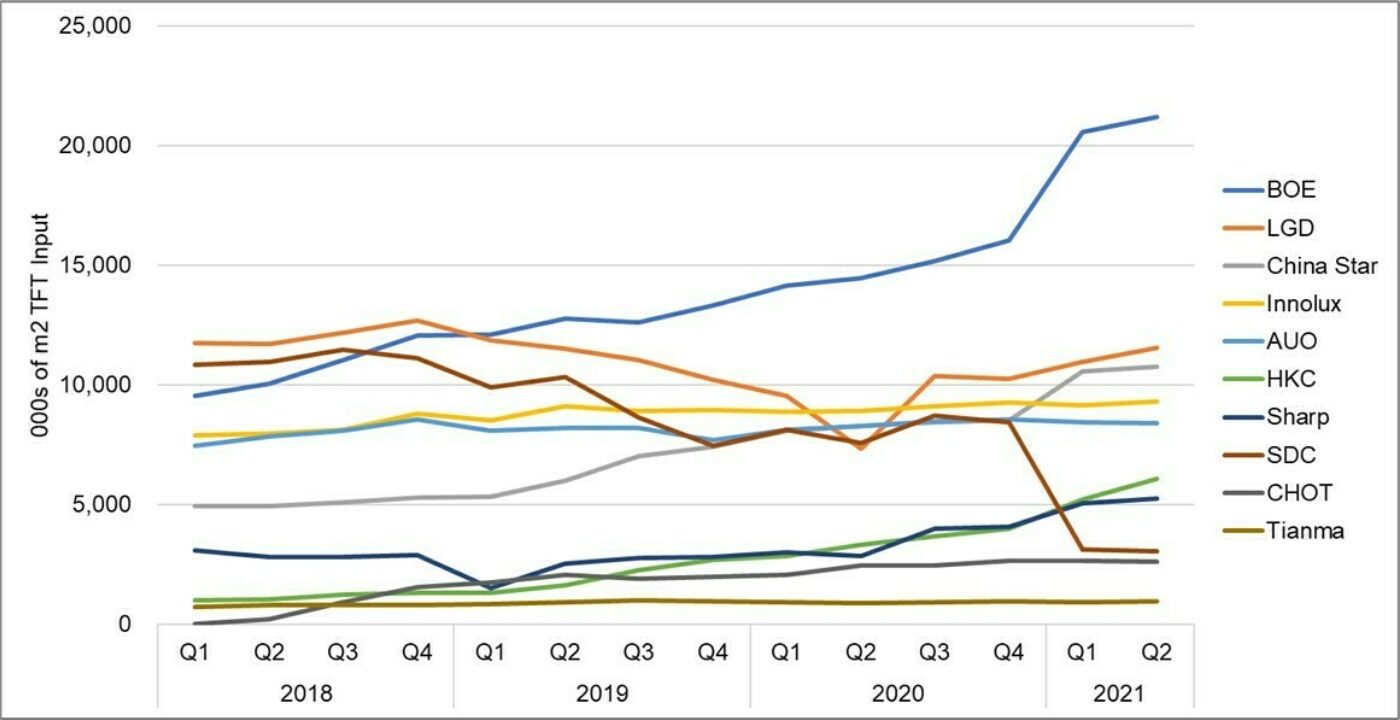
A view of TFT input by panel maker shows the increasing dominance of BOE. Starting in Q1 2021, we count BOE’s Gen 8.5/8.6 fabs newly acquired from CEC Panda in their total. Similarly, starting this quarter we count the Gen 8.5 fab in Suzhou, China as capacity and input for China Star after they acquired this fab from SDC. In Q2 2021, we expect that BOE will represent 26% of industry TFT input, with China Star another 13%.
With the rebound in LCD TV panel prices, LGD has delayed its plans to shut down LCD capacity in Korea, and LGD continues to maintain a high utilization on its Korea lines in the first half of 2021. The delayed shutdown has allowed LGD to hold onto the #2 position in TFT input ahead of China Star. In contrast, Samsung has slowed down utilization on its LCD lines in Korea, and with the loss of China capacity, Samsung has fallen to #7 in TFT input.
Quarterly TFT Input by Panel Maker, 2018-2021
The strong utilization across the industry, combined with increased LCD panel prices, is certain to result in robust profitability for flat panel display makers in the first half of 2021. DSCC’s Quarterly All Display Fab Utilization Report (一部実データ付きサンプルをお送りします) covers capacity, TFT Input and utilization by month for every flat panel display fab in the industry, with pivot tables to allow segmentation by supplier, country, TFT fab generation, backplane, frontplane or substrate type. The report provides historical utilization back to Q1 2018 and a forecast by month for the first six months of 2021.
About Counterpoint
https://www.displaysupplychain.co.jp/about
[一般のお客様:本記事の出典調査レポートのお引き合い]
上記「国内お問い合わせ窓口」にて承ります。会社名・部署名・お名前、および対象レポート名またはブログタイトルをお書き添えの上、メール送信をお願い申し上げます。和文概要資料、商品サンプル、国内販売価格を返信させていただきます。
[報道関係者様:本記事の日本語解説&データ入手のご要望]
上記「国内お問い合わせ窓口」にて承ります。媒体名・お名前・ご要望内容、および必要回答日時をお書き添えの上、メール送信をお願い申し上げます。記者様の締切時刻までに、国内アナリストが最大限・迅速にサポートさせていただきます。