国内お問い合わせ窓口
info@displaysupplychain.co.jp
FOR IMMEDIATE RELEASE: 02/08/2021
[Blog] Strong Q4 Pulls AUO and Innolux to Full Year Profit for 2020
Bob O'Brien, Co-Founder, Principal AnalystAnn Arbor, MI USA -
The two big Taiwan panel makers reported their Q4 2020 results this week, and as expected both posted their biggest profits in more than three years. In addition, both companies managed to book profits for the full year 2020.
AUO
AUO reported its biggest net profit since Q2 2017, beating expectations from the top to the bottom of the income statement. AUO reported a net profit of TWD 8.9 billion (US$312 million) on revenues of TWD 80.5 billion (US$2.8 billion). Revenues were up 13% Q/Q and 39% Y/Y and exceeded consensus analyst expectations of TWD 78.3 billion. The net profit was another huge improvement from the Q3 2020 net profit of TWD 3.0 billion (US$103 million) and the prior year net loss of TWD 9.1 billion (US$300 million) in Q4 2019, and the Q4 2020 profit exceeded consensus expectations of TWD 5.9 billion.
AUO Income Statement Highlights and Margins, 4Q18 to 4Q20
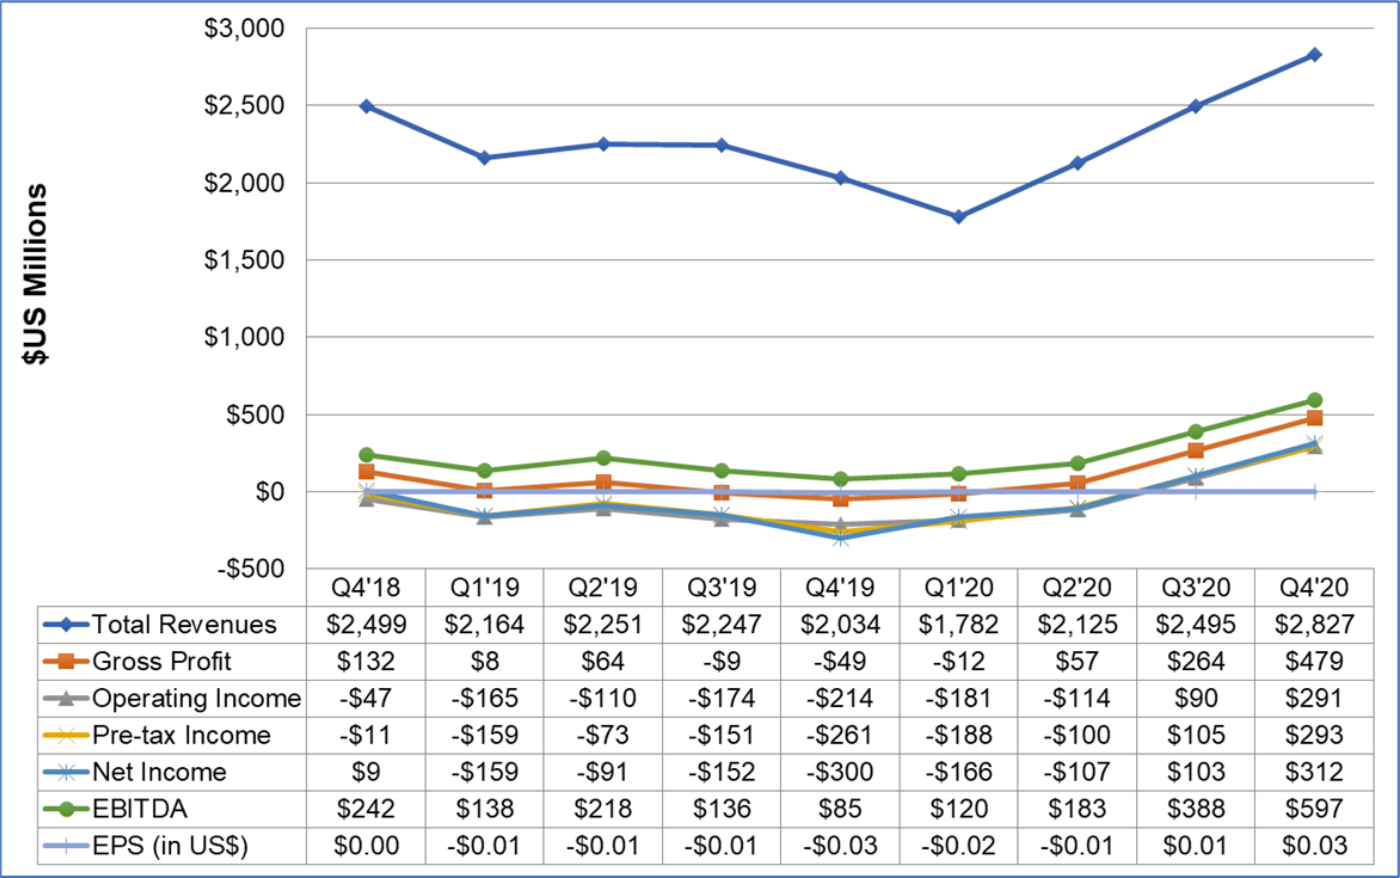
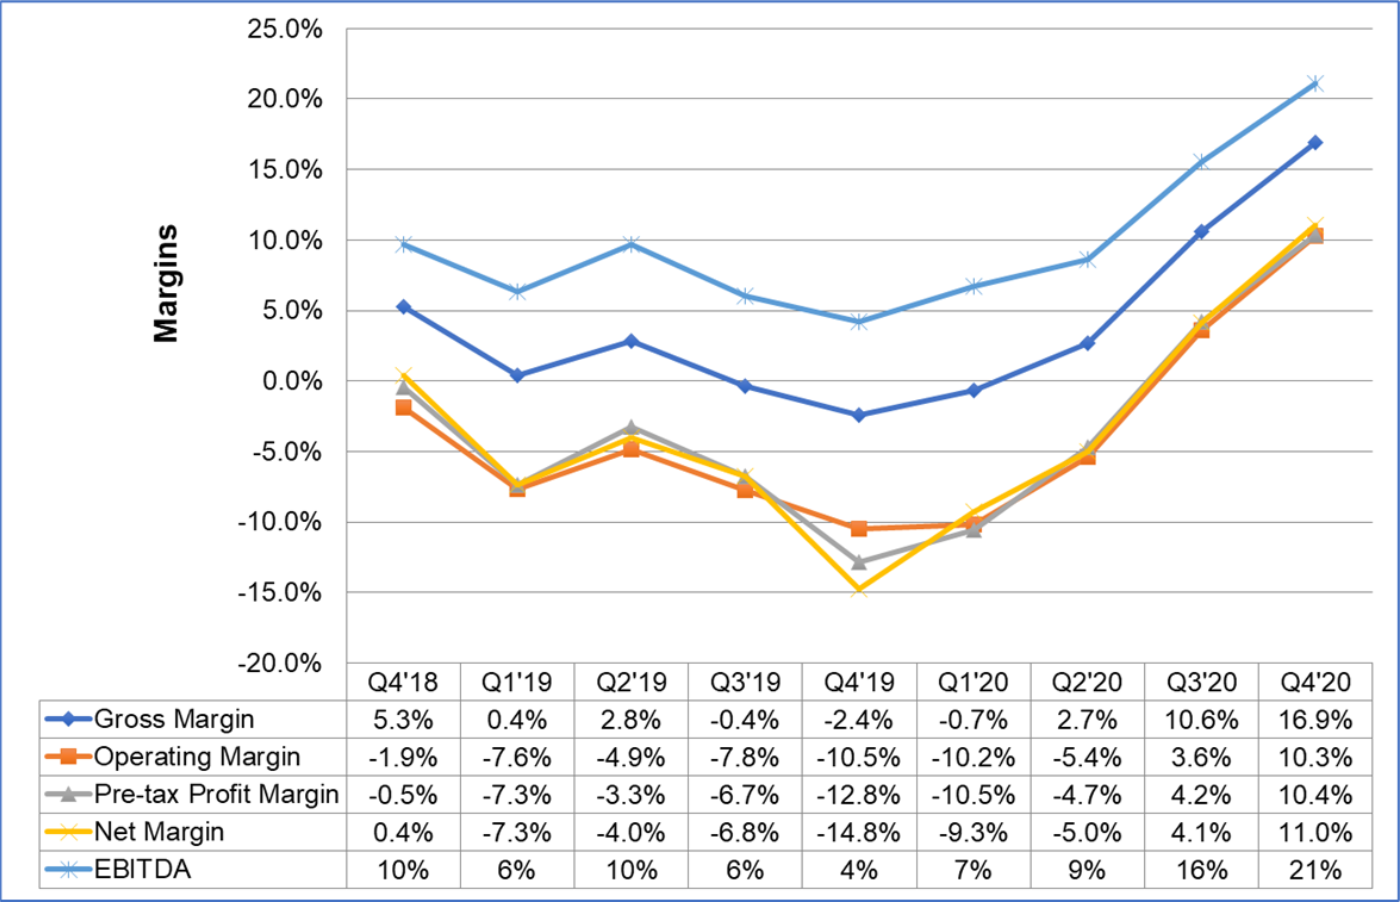
AUO’s recovery in Q3 came despite headwind from foreign exchange: FX had an unfavorable effect on margins of 1% as the Taiwan dollar strengthened against both the US dollar and the Japanese yen. Rising panel prices allowed AUO to improve on all of its margins from between 5% and 7%, and AUO’s gross margins and EBITDA margins reached the highest point since Q3 2017.
For the full year 2020, AUO posted a net income of TWD 3.7 billion ($141 million) on revenues of TWD 271 billion ($9.2 billion). Revenues increased less than 1% over 2019, but the net profit compared with a net loss in 2019 of TWD 21.6 billion ($702 million). AUO has now posted a net profit in seven of the last eight years.
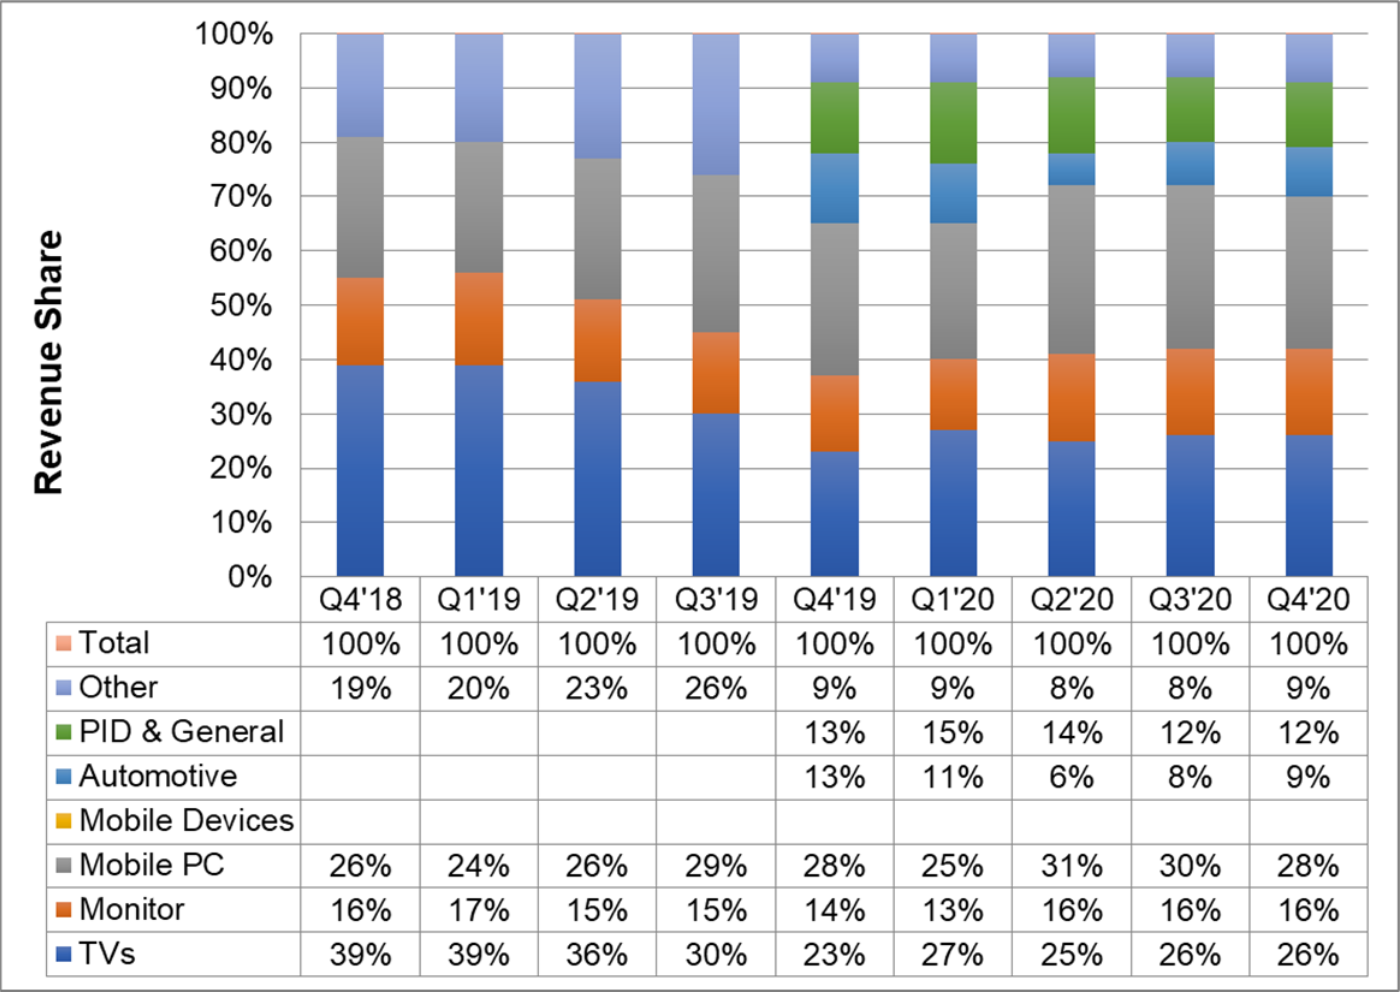
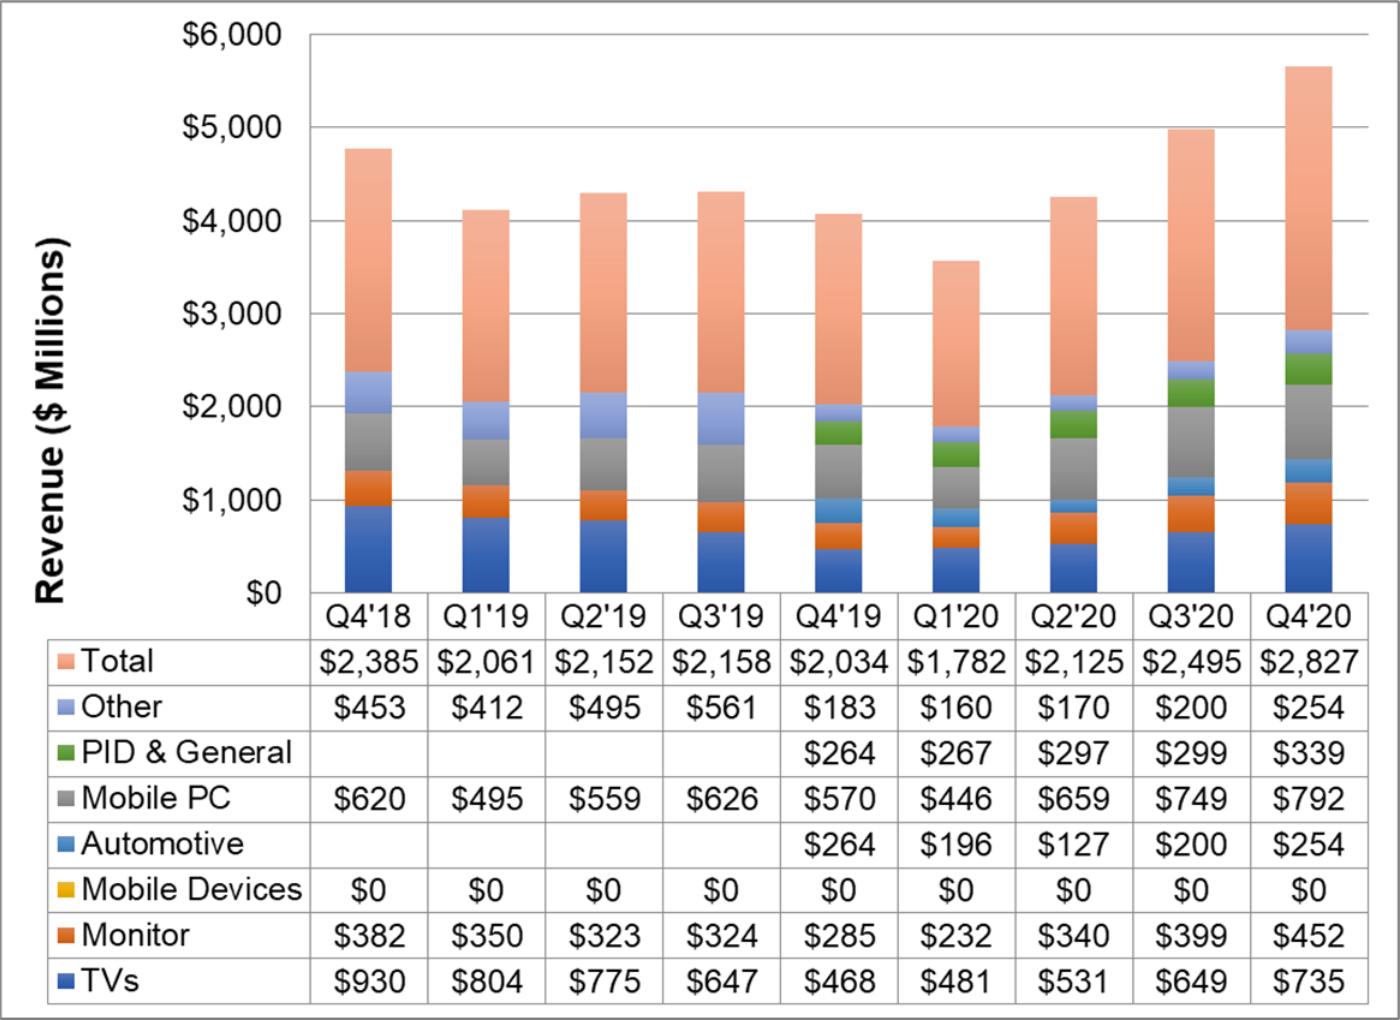
AUO changed its reporting structure for revenues by application. Up through Q3 2020, AUO had reported its display revenues separately from corporate revenues, with the remainder from its solar panel business, but displays had represented 97% of revenues. Starting from Q4 2020, AUO now reports total revenues by application, with the solar revenues in its “Other” category. AUO also broke out its display revenues for automotive panels and for PID and general displays for the first time. During the earnings call AUO executives explained that these non-consumer segments had a different business model than the consumer segments for TV, IT and Mobile, with more value-added and less subject to industry supply/demand swings.
AUO’s revenue mix by application showed only small changes from Q3 to Q4, as revenues for all applications increased. Likewise, its revenues by screen size changed only slightly: 40-49” increased from 7% to 9% while <10” decreased from 14% to 12%. The main driver of AUO’s revenue and profit increase was simple: selling panels at higher prices. AUO’s area shipments decreased by 1% Q/Q but increased 9% Y/Y at 6.8 million square meters, but area ASPs increased by 13% Q/Q and 26% Y/Y to $376 per square meter, the highest level since Q3 2017.
AUO Revenue Share and Revenues by Application, 4Q18 – 4Q20
AUO recorded its highest operating cash flow since Q4 2017 at TWD 18.8 billion ($659 million) and its highest free cash flow since at least 2015 at TWD 15.4 billion ($542 million). Inventory remained under control, and inventory days decreased from 37 to 36 days.
AUO’s balance sheet remains healthy, with debt stable in the quarter and equity increasing by 10% Q/Q. AUO’s book value of debt-to-equity ratio decreased from 66% to 60% and its net debt-to-equity ratio decreased from 23% to 14%. AUO’s market value of TWD 167 billion ($5.8 billion) as of February 4th is 86% of book value, so debt to market equity is 70%.
AUO offered optimistic guidance for the current quarter and 2021. AUO expects sequentially:
- Area shipments to decrease by high-single digits %;
- Area ASP up by high-single digits %;
- Loading rates remaining at high levels. Q4 loading was more than 95%.
In the earnings call, AUO expressed a positive sentiment about 2021. Some other notes from the earnings call:
- The shortage of components has continued; AUO cited glass in tight supply. AUO also said that display driver ICs are in short supply, but AUO’s long and steady relationship with DDIC suppliers gives it an advantage.
- On top of components, AUO has seen a labor shortage in mainland China, with the availability of workforce in its mainland sites tight.
- AUO believes that the China government has achieved its goals in the display industry with more than 60% of worldwide capacity there, and that the government is turning its attention to semiconductors. Therefore, capacity increases in China are not likely to be as common in the coming years as in 2017-2020.
- AUO discussed a new spin-off, AUO DisplayPlus, organized for vertical integration of display applications.
- AUO expects capex of TWD 22 billion ($772 million) in 2021, with a focus on increasing capability for IT panels. AUO’s board approved a multi-year plan for TWD 39 billion in capex, but only TWD 22 billion would be spent this year.
Innolux
Like its compatriot AUO, for Q4 2020 Innolux reported a profit surge which brought full year results into the black. Innolux revenues increased 8% Q/Q and 27% Y/Y to TWD 78.1 billion ($2.74 billion), exceeding analyst expectations of TWD 74.7 billion. Across the income statement all margins improved by between 10% and 12%, and net income of TWD 10.1 billion ($356 million) nearly doubled analyst expectations of TWD 5.5 billion.
Innolux Income Statement Highlights and Margins, 4Q18 to 4Q20
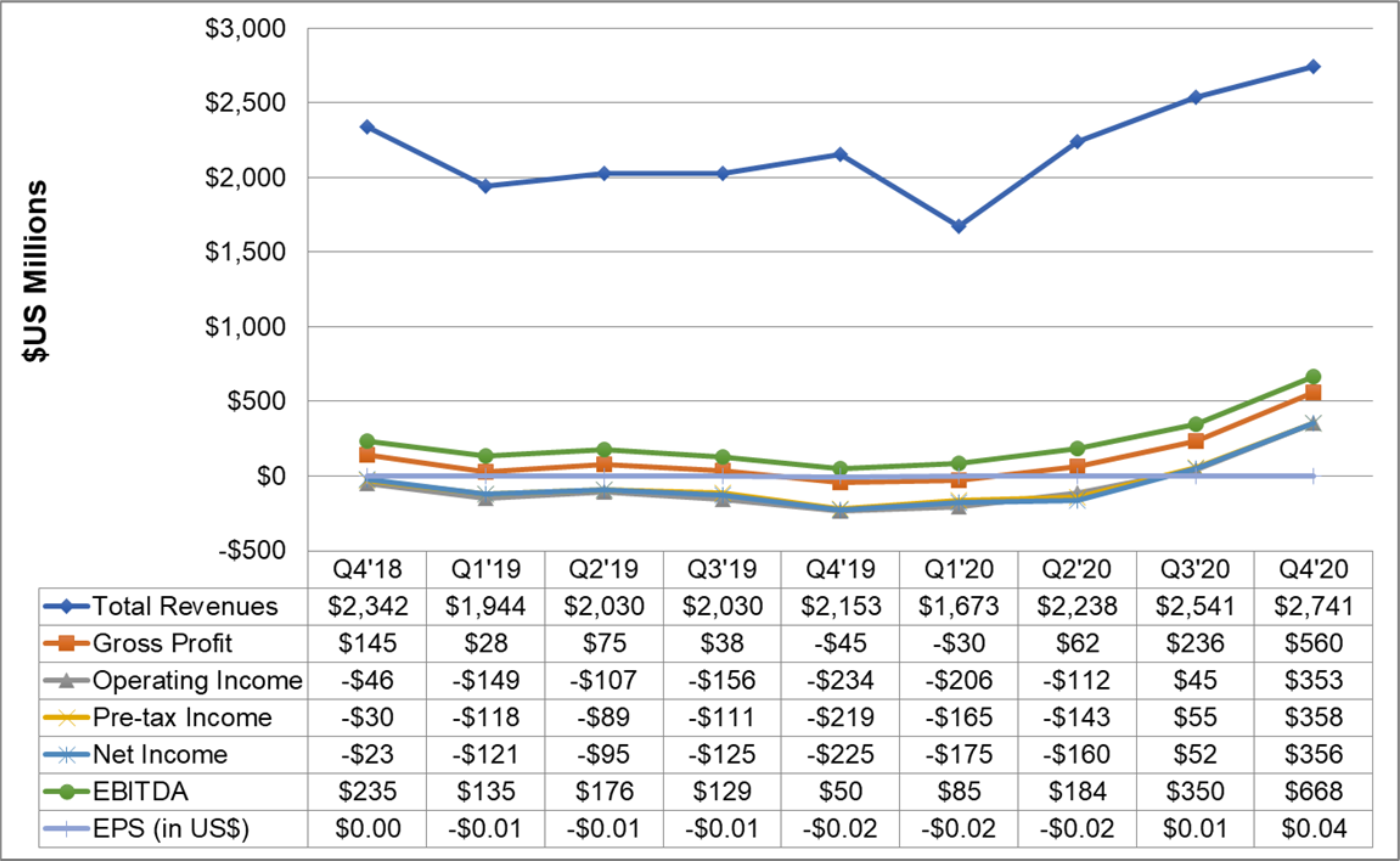
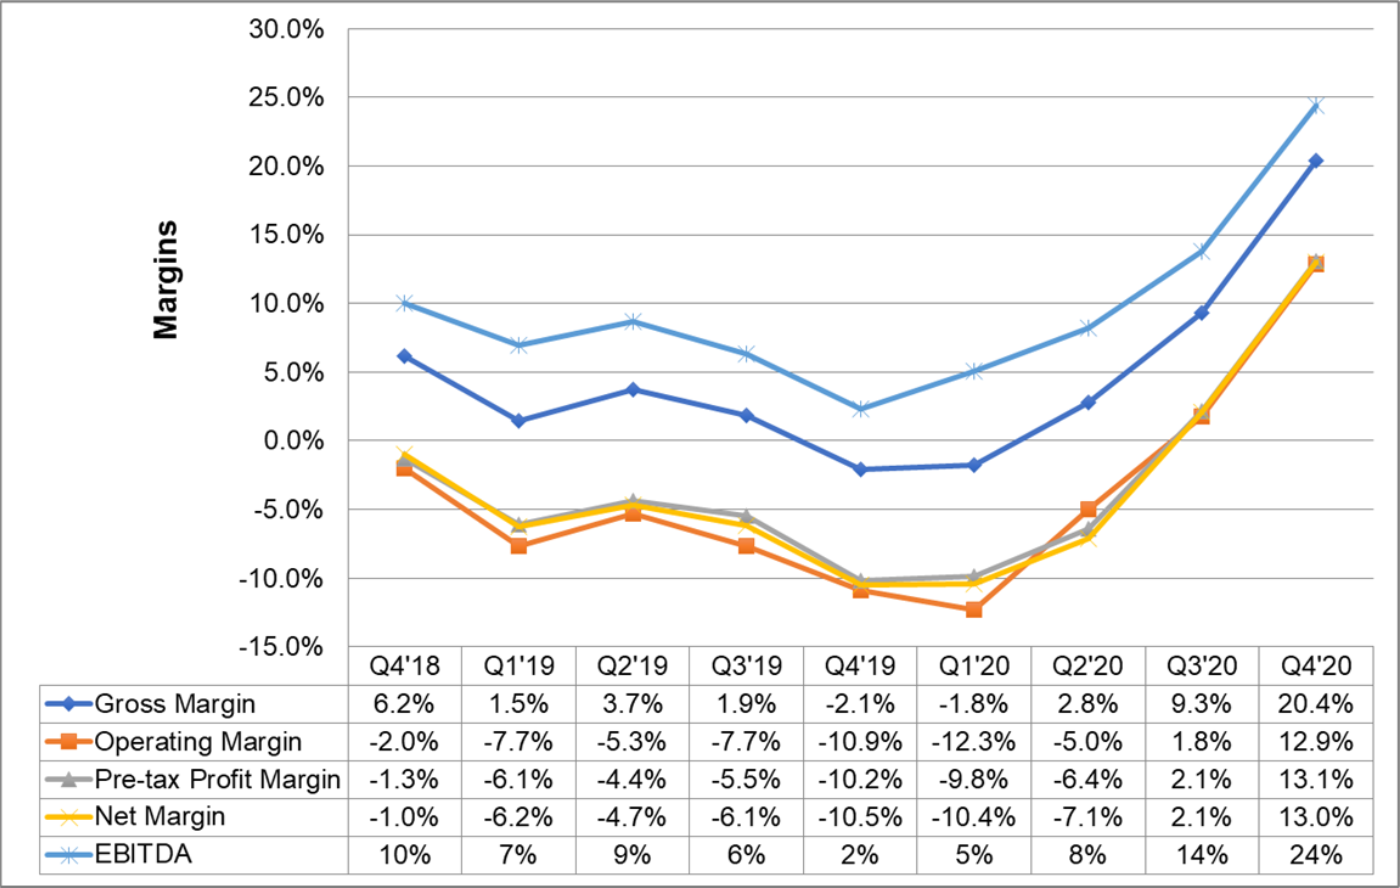
Similar to the pattern with AUO, Innolux achieved higher revenues primarily through higher area prices, and despite a small decrease in area shipments. Innolux area shipments decreased 5% Q/Q and 2% Y/Y to 7.4 million square meters, but area prices increased 12% Q/Q and 32% Y/Y to $362 per square meter. Innolux’s area prices reached their highest point since Q3 2017.
As the price of LCD TV panels continued to increase in Q4, the product mix for Innolux shifted toward that application, with TVs increasing from 34% to 38% of revenues at the expense of mobile PC and cell phone panels, both of which lost 2% revenue share in the quarter. In absolute revenue terms, revenues from mobile PC and cell phone panels were flat Q/Q, while revenues from desktop increased by 8% Q/Q and revenues from TV increased by 21% Q/Q.
Like AUO, Innolux’s guidance was relatively optimistic for Q1, which is typically the slow season. Innolux expects sequentially:
- Large panel shipments to be flat Q/Q;
- Blended ASP to be up by high single digit % Q/Q;
- Small & medium panel shipments to be down by a low-single digit % Q/Q.
Innolux expects that the demand for WFH products and TV continues to rise because of the pandemic, and noted that “the traditional off-season has turned to a peak season.” The tight upstream supply chain situation supports increasing panel prices.
About Counterpoint
https://www.displaysupplychain.co.jp/about
[一般のお客様:本記事の出典調査レポートのお引き合い]
上記「国内お問い合わせ窓口」にて承ります。会社名・部署名・お名前、および対象レポート名またはブログタイトルをお書き添えの上、メール送信をお願い申し上げます。和文概要資料、商品サンプル、国内販売価格を返信させていただきます。
[報道関係者様:本記事の日本語解説&データ入手のご要望]
上記「国内お問い合わせ窓口」にて承ります。媒体名・お名前・ご要望内容、および必要回答日時をお書き添えの上、メール送信をお願い申し上げます。記者様の締切時刻までに、国内アナリストが最大限・迅速にサポートさせていただきます。