国内お問い合わせ窓口
info@displaysupplychain.co.jp
FOR IMMEDIATE RELEASE: 02/08/2021
[Blog] Q4 Profits Rolled in for TV Brands
Bob O'Brien, Co-Founder, Principal AnalystAnn Arbor, MI USA -
The top three TV brands continued to report terrific profits in Q4 despite the substantial increase in LCD TV panel prices, as strong demand brought increased revenues that overwhelmed the increased costs. With LGE and Sony reporting their Q4 results in addition to Samsung (covered in last week’s issue), we have results from the top three brands. The #4 brand in revenue and #2 in units, TCL, has reported a 16% Y/Y increase in TV units, but has not reported on revenues or profits. When TCL reports later this month, we will add that company’s Q4 to this analysis.
After a dismal first half of 2020, strong sales in Q3 led to a concern that TV sales for the traditional holiday selling season had been pulled forward into the summer. Such concerns were unfounded, as the top three brands booked big Y/Y increases in revenues and profits.
While these top four TV brands (Samsung, LG, Sony and TCL) are not the entire TV industry, they represent a big portion of the industry and nearly all of its cutting edge. In Q3 2020, these four brands represented 57% of the unit shipments of all TVs, and 85% of Advanced TV shipments.
The three top global brands report their TV business as the major part of a business segment, and in each case they name the segment slightly differently.
- Samsung reports TV within its Visual Display segment, a part of its Consumer Electronics group that also includes Digital Appliances.
- Sony reports TV within its Electronics Products and Solutions (EP&S) business segment, which also includes audio/video products, still and video cameras, smartphones, and other electronics products. Sony continues to disclose revenues and unit sales from its TV business, but reports operating profits for EP&S. TV revenues are only about 1/3 of EP&S.
- LG Electronics calls their segment a simpler Home Entertainment (HE), but LG restructured its HE business starting in Q1 2020, moving its IT business from HE to its Business Solutions segment. IT represented about 20% of the old HE business segment in 2019 in both revenues and profits.
The quarterly revenues of the top four brands’ TV businesses are shown in the first chart here in US dollars. Note that the chart shows corporate revenues for TCL Electronics, business division revenues for Samsung and LGE, and TV-only revenues for Sony. LGE HE revenues until the end of 2018 include its IT business, but starting in Q1 2019 exclude IT. All four brands show to some extent the typical seasonality of the TV business with a 4th quarter spike followed by a decline in Q1 and relatively flat Q2-Q3, but TCL results are notably smoother on a seasonal basis. In these charts, we see a 2020 spike in Q3 followed by an additional boost in Q4.
TV Business Revenues of Global Brands, 2014 – 4Q 2020
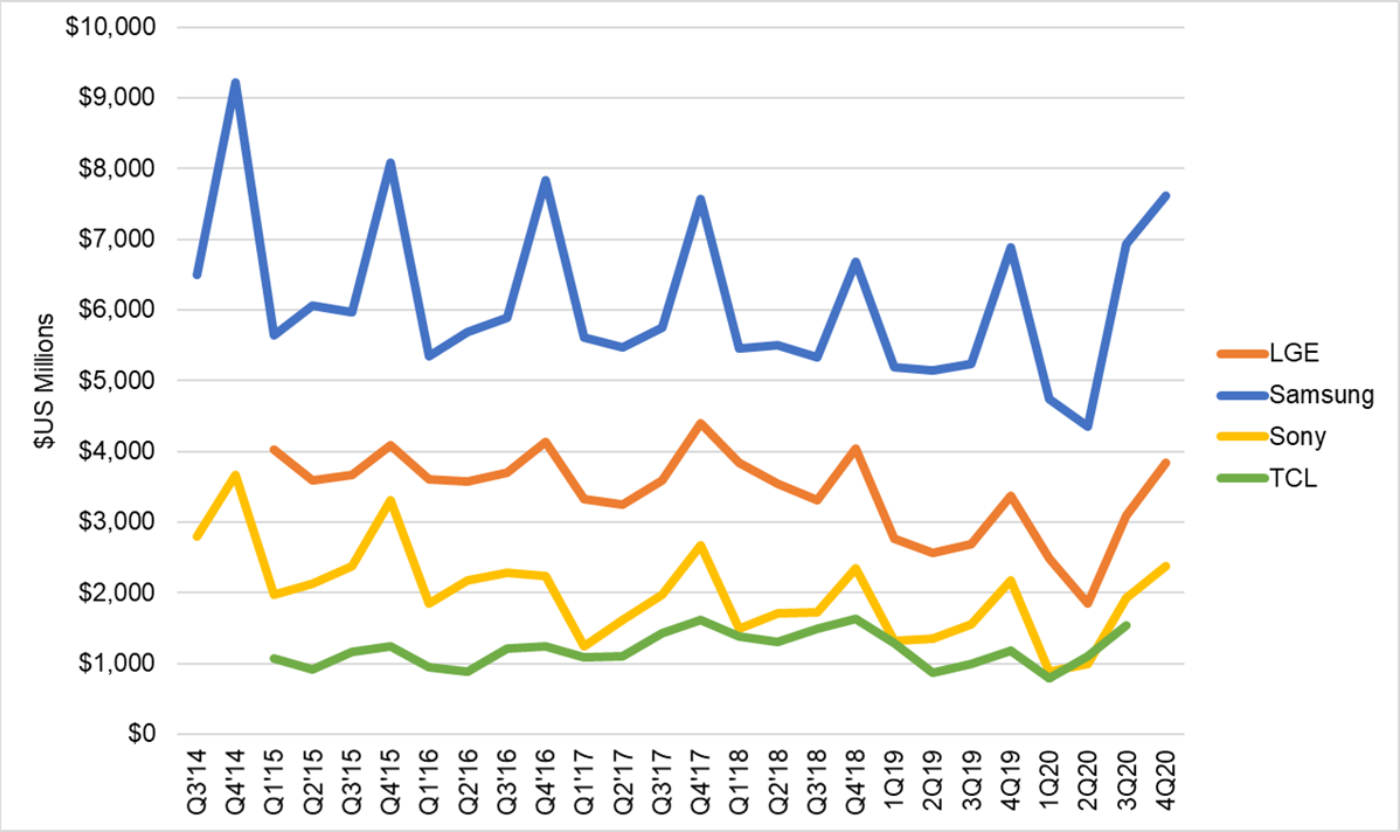
The pace of Y/Y increase slowed down in Q4 2020, but all three brands reported Y/Y increases in revenues. LGE, Samsung and Sony posted Y/Y revenue increases of 13%, 11%, and 9%, respectively. Samsung’s revenue was the highest in four years, and Sony’s was the highest in three years.
In its earnings release, Sony noted that the Y/Y revenue increase was driven by an improved product mix, and happened despite a Y/Y decrease in TV units. Sony’s TV sales decreased from 3.4 million in Q4 2019 to 3.2 million in Q4 2020, but its average selling price increased from $638 to $742. For its part, LG Electronics did not mention units or ASP, simply stating that revenue was driven by growth in advanced markets such as North America and Europe.
Although both Samsung and LGE cited increased panel prices as a headwind for profits, all three companies reported Y/Y increases in operating profits. Samsung could not match the outstanding performance from Q3 2020, when it booked KRW 1.6 trillion ($1.3 billion) in operating profits, but still managed to bring in KRW 800 billion ($734 million). LGE took the biggest Y/Y increase, but partly because its Q4 2019 was disappointing and close to break-even. LGE recorded operating profits of KRW 204 billion ($183 million), while Sony’s TV profits increased by 44% Y/Y to $387 million .
On an operating margin basis, shown on the next chart, we can see that Sony took the prize with 15% operating margin in its EP&S segment, while margins for LGE and Samsung declined on a Q/Q basis. Sony’s quarterly operating margins need to be interpreted with some caution, though, because Sony persistently shows much worse performance in their fiscal year-ending Q1, as the chart shows.
TV Division Operating Profit Margins of Global Brands, 2014 to Q3 2020
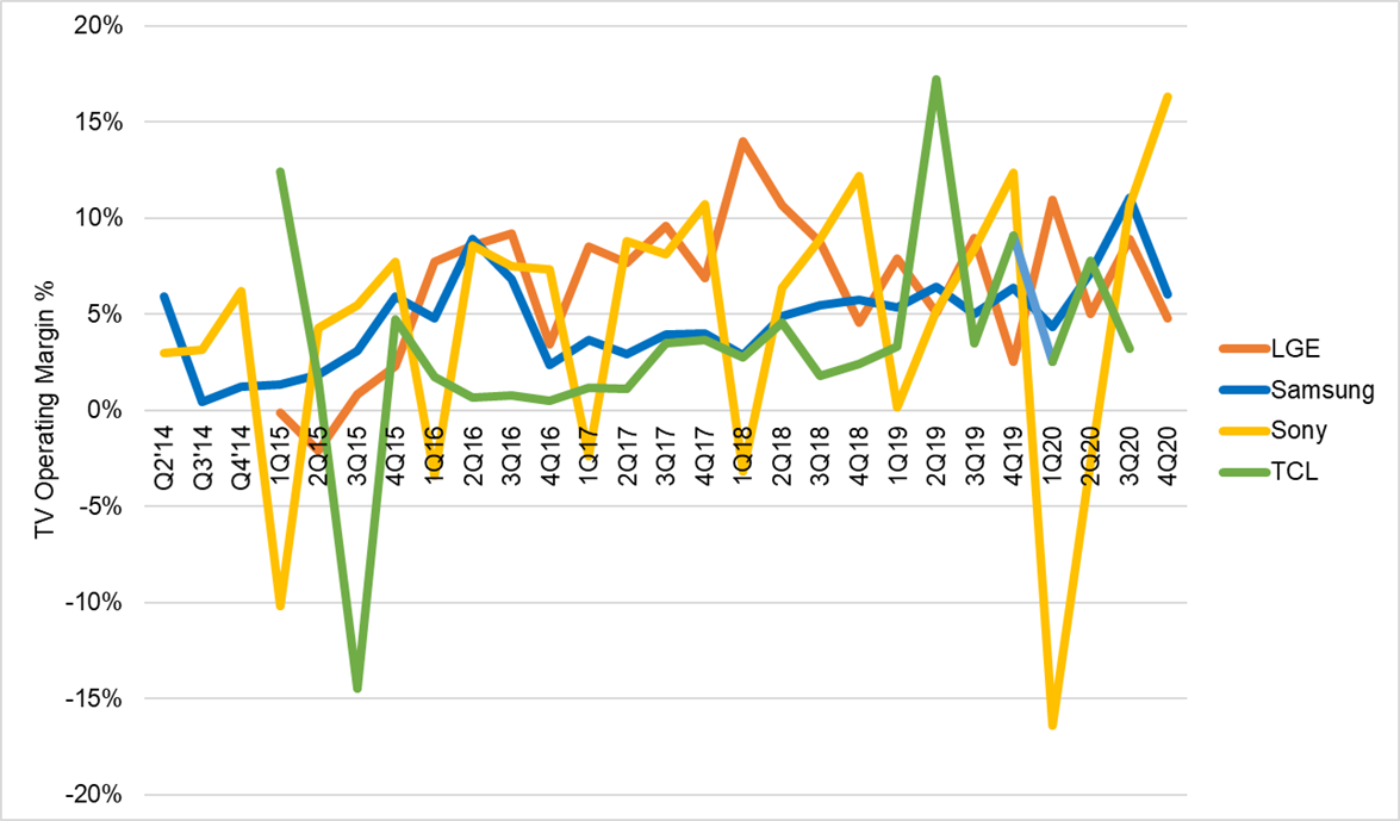
The strong profit margins of all three of these brands indicates that increased panel prices did not drive TV makers to operating losses. Undoubtedly the strong unit volumes and the strength of the market in premium TVs helped the profits of all three brands. There is also a time lag between the sale of an LCD panel and the sale of a TV set; this can be 6-7 weeks, so about ½ a quarter. This means that the average LCD panel prices paid by TV setmakers will continue to increase in Q1 and perhaps again in Q2 2021. With pandemic-driven demand continuing strong in the first half of 2021, TV makers can continue to be profitable, but with panel prices rising more of those profits will go to their panel suppliers.
About Counterpoint
https://www.displaysupplychain.co.jp/about
[一般のお客様:本記事の出典調査レポートのお引き合い]
上記「国内お問い合わせ窓口」にて承ります。会社名・部署名・お名前、および対象レポート名またはブログタイトルをお書き添えの上、メール送信をお願い申し上げます。和文概要資料、商品サンプル、国内販売価格を返信させていただきます。
[報道関係者様:本記事の日本語解説&データ入手のご要望]
上記「国内お問い合わせ窓口」にて承ります。媒体名・お名前・ご要望内容、および必要回答日時をお書き添えの上、メール送信をお願い申し上げます。記者様の締切時刻までに、国内アナリストが最大限・迅速にサポートさせていただきます。