国内お問い合わせ窓口
info@displaysupplychain.co.jp
FOR IMMEDIATE RELEASE: 01/18/2021
LCD TV Panel Prices Continue Rising in Q1 2021
Bob O'Brien, Co-Founder and PresidentAnn Arbor, MI USA -
Continuing strong demand and concerns about a glass shortage resulting from NEG’s power outage have led to a continuing increase in LCD TV panel prices in Q1. Announcements by the Korean panel makers that they will maintain production of LCDs and delay their planned shutdown of LCD lines has not prevented prices from continuing to rise.
Panel prices increased more than 20% for selected TV sizes in Q3 2020 compared to Q2, and by 27% in Q4 2020 compared to Q3, and we now expect that average LCD TV panel prices in Q1 2021 will increase by another 9%.
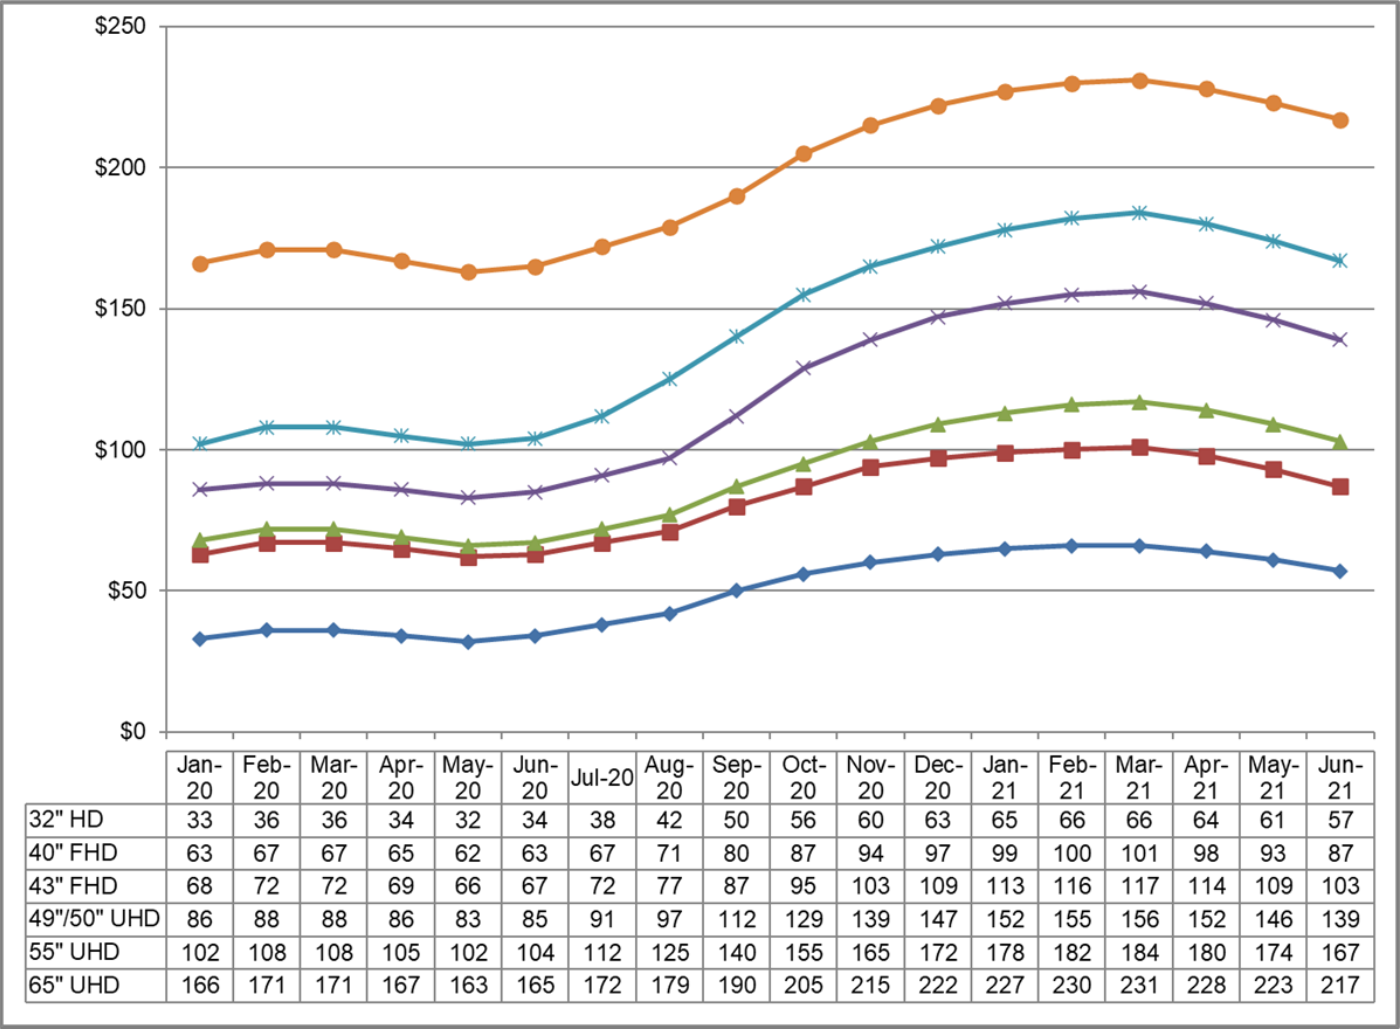
The first chart shows our latest TV panel price update, with prices increasing across the board from a low in May 2020 to an expected peak in February/March of this year before they start to decline again. The inflection point for this cycle, the month of the biggest M/M price increases, was passed in September 2020 and the price increases have been slowing down each month since then. Prices in January 2021 have reached levels last seen exactly three years ago in January 2018.
Prices increased in Q4 for all sizes of TV panels, with massive % increases in sizes from 32” to 55” ranging from 28% to 38%. Prices for 65” and 75” increased at a slower rate, by 19% and 8% respectively, as capacity has continued to increase on those sizes with Gen 10.5 expansions.
Prices for every size of TV panel will increase in Q1 at a slower rate, ranging from 4% for 75” to 13% for 43”. Although we continue to expect that the long-term downward trend will resume in the second quarter of 2021, we no longer expect that panel prices will come close to the all-time lows seen earlier this year. The situation remains dynamic, and the pandemic may continue to affect both supply and demand.
LCD TV Panel Prices January 2020 – June 2021
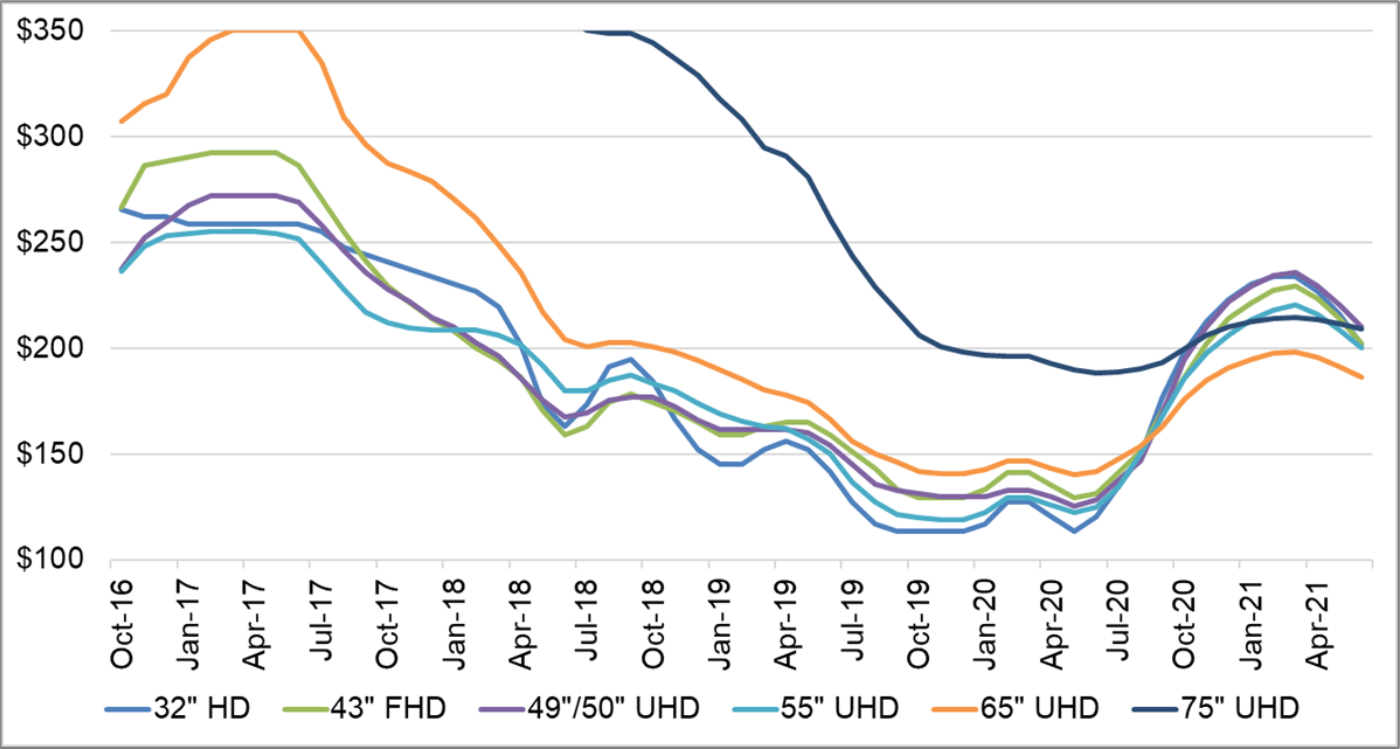
We have now seen in this cycle trough-to-peak increases in TV panel prices that exceed the sharp increases of the last up-cycle, in the summer of 2016. Comparing our forecast for March 2021 panel prices, when we expect prices to peak, with the prices in May 2020, we see trough-to-peak increases from 13% for 75” to 106% (!) for 32”, with an average of 67%. In comparison, the trough-to-peak increase of the 2016-2017 cycle was 48%.
The bellwether 32” TV panel typically shows the fastest drops to the lowest area prices in times of oversupply, and the sharpest price increases in times of supply constraint, and we show that pattern repeating itself in this up-cycle. In May 2020, 32” panel prices matched their all-time lows at $32, but these panels will peak at more than twice that, at $66. The price of 75” panels has not followed the same pattern, with much smaller increases.
Whereas in May 2020, 75” panels sold at an area premium of $77 per square meter higher than the 32” panel price, by February 2021 they will sell at a $20 discount on an area basis. This means that those Gen 10.5 fabs could earn higher revenues from making 32” panels than from 75” panels. The pattern for 65” also deviates from the smaller sizes, and 65” now is the lowest-priced size on an area basis, selling at a $35 per square meter discount compared to 32”.
Monthly Area Prices per Square Meter for TV Panels, October 2016 – June 2021
The improved pricing for mid-range (32-55”) TV will boost the profitability of panel makers, especially the two large Taiwanese players and LG Display, who have Gen 7.5 and Gen 8.5 fabs but no Gen 10.5 fabs. Chinese panel makers HKC and CEC Panda have a similar industrial profile and stand to benefit, while the leading companies with Gen 10.5 fabs (BOE, CSOT, and Foxconn/Sharp) stand to benefit less, because the price increases on the largest sizes are more modest.
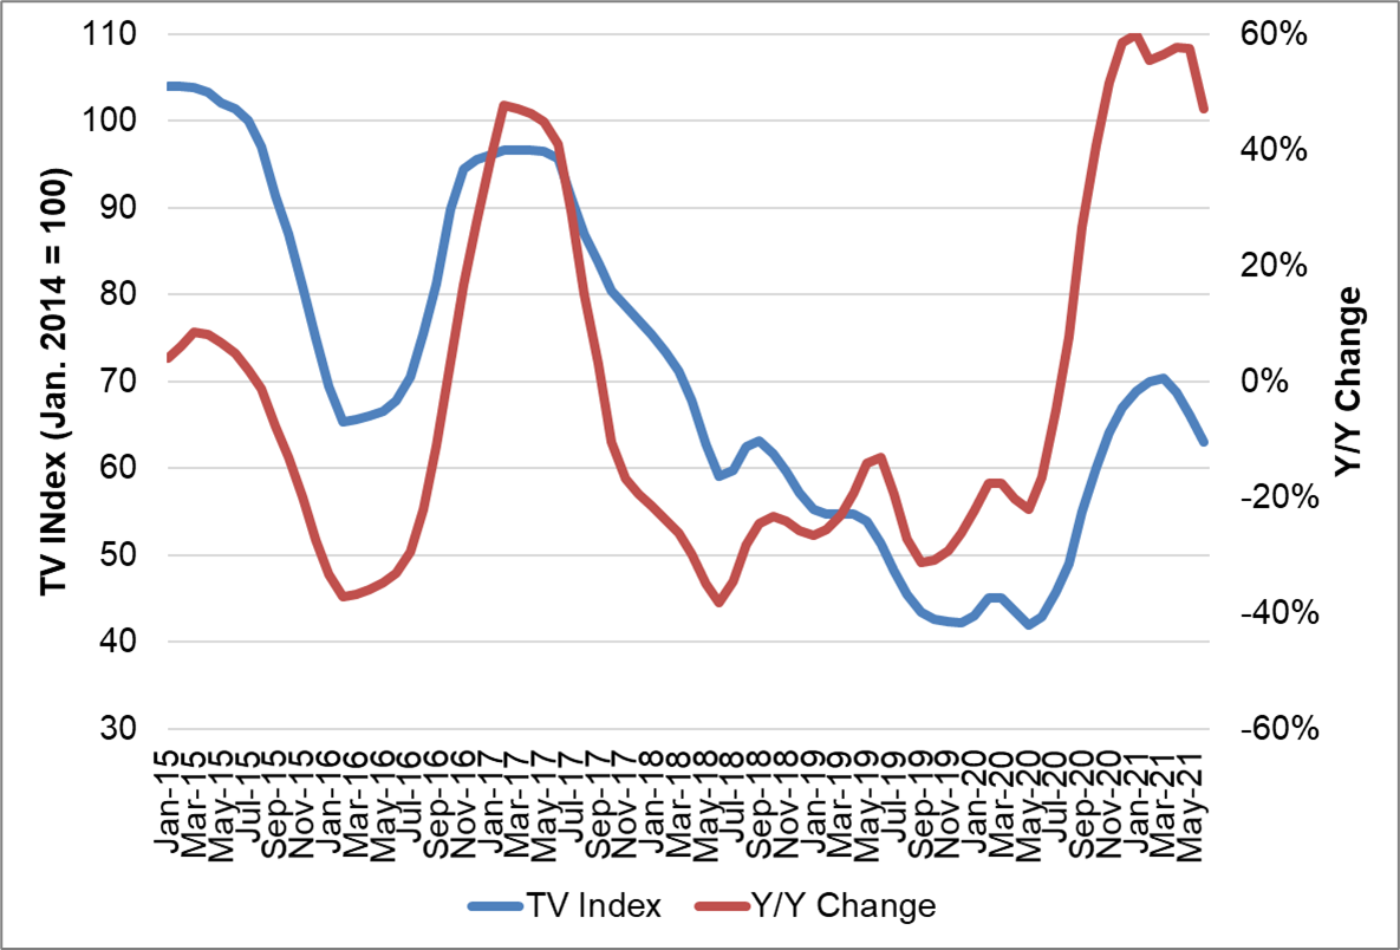
The last chart here shows our TV price index, set to 100 for prices in January 2014, and the Y/Y change of LCD TV panel prices. Our index has increased from its all-time low of 42.0 in May 2020 to 69 in January, and we expect it to peak at 70.4 in March before declining in Q2 2021. The Y/Y increase is peaking in January at 60% and will remain at elevated levels through the first half of 2021.
TV Panel Price Index and Y/Y Change, January 2015 – June 2021
For three years from 2017 to 2020, LCD panel makers suffered through a continuous pattern of price declines interrupted only with brief respites. With the COVID-19 demand surge assisted by a glass shortage, panel prices are spiking. We expect all the panel makers to report robust Q4 margins and expect the good news to continue in 2021.
About Counterpoint
https://www.displaysupplychain.co.jp/about
[一般のお客様:本記事の出典調査レポートのお引き合い]
上記「国内お問い合わせ窓口」にて承ります。会社名・部署名・お名前、および対象レポート名またはブログタイトルをお書き添えの上、メール送信をお願い申し上げます。和文概要資料、商品サンプル、国内販売価格を返信させていただきます。
[報道関係者様:本記事の日本語解説&データ入手のご要望]
上記「国内お問い合わせ窓口」にて承ります。媒体名・お名前・ご要望内容、および必要回答日時をお書き添えの上、メール送信をお願い申し上げます。記者様の締切時刻までに、国内アナリストが最大限・迅速にサポートさせていただきます。