国内お問い合わせ窓口
info@displaysupplychain.co.jp
FOR IMMEDIATE RELEASE: 02/01/2021
[Blog] Samsung Profits Slow Down in Q4
Bob O'Brien, Co-Founder, Principal AnalystAnn Arbor, MI USA -
After a record-breaking Q3, Samsung Electronics slowed down a bit in Q4 as sales of its smartphone products slumped, but strong revenues in display products and other divisions kept the company on a Y/Y growth path.
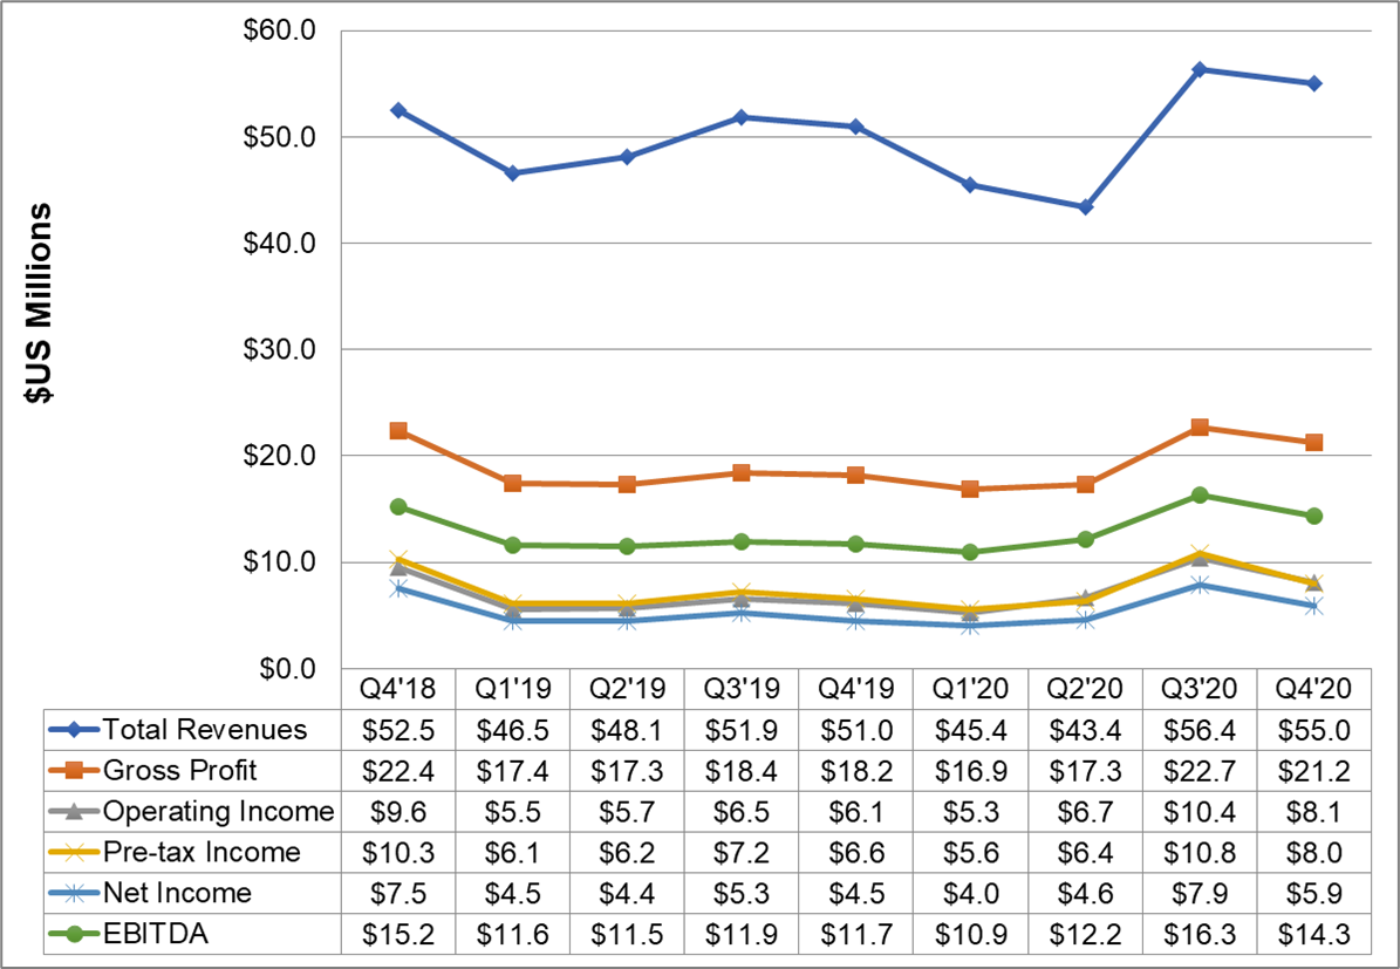
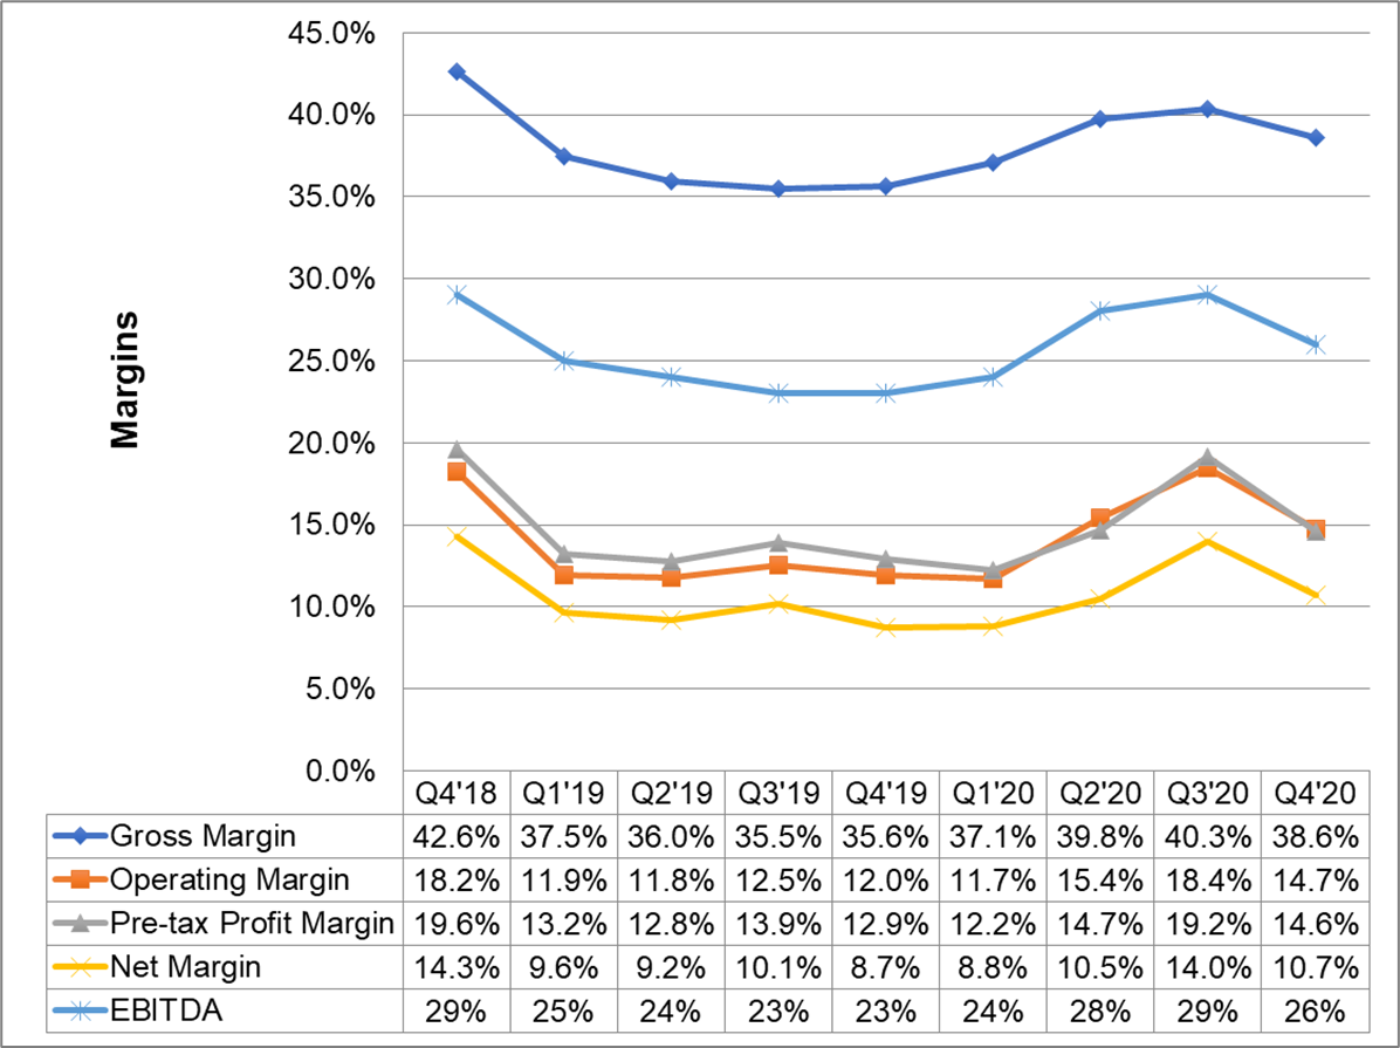
Samsung posted net income of KRW 6.7 trillion (US$6.0 billion) on revenues of KRW 61.6 trillion ($54.7 billion). Revenues were down 2% Q/Q but up 8% Y/Y and slightly exceeded consensus analyst expectations of KRW 61.2 trillion. Net income was down 25% sequentially but up 33% Y/Y, but fell short of consensus expectations of KRW 6.7 trillion. Margins decreased across the board by 2-4%, driven by softness in the high-margin Semi business. Several divisions were hurt by currency effects, as the Korean won gained nearly 6% against the US dollar in Q4.
Samsung Electronics Income Statement and Margins, 4Q 2018 – 4Q 2020
The slowdown was greatest in the smartphone business, as Samsung faced the iPhone 12 launch. Samsung’s IT & Mobile (IM) business saw its revenue decrease 27% Q/Q and 10% Y/Y and its operating profits fall 46% Q/Q and 4% Y/Y as Samsung sold 67 million handsets, a 24% decrease Q/Q, and 10 million tablets with an average selling price of $205.
Samsung Electronics Division Revenue and Operating Profit, 4Q 2018 – 4Q 2020
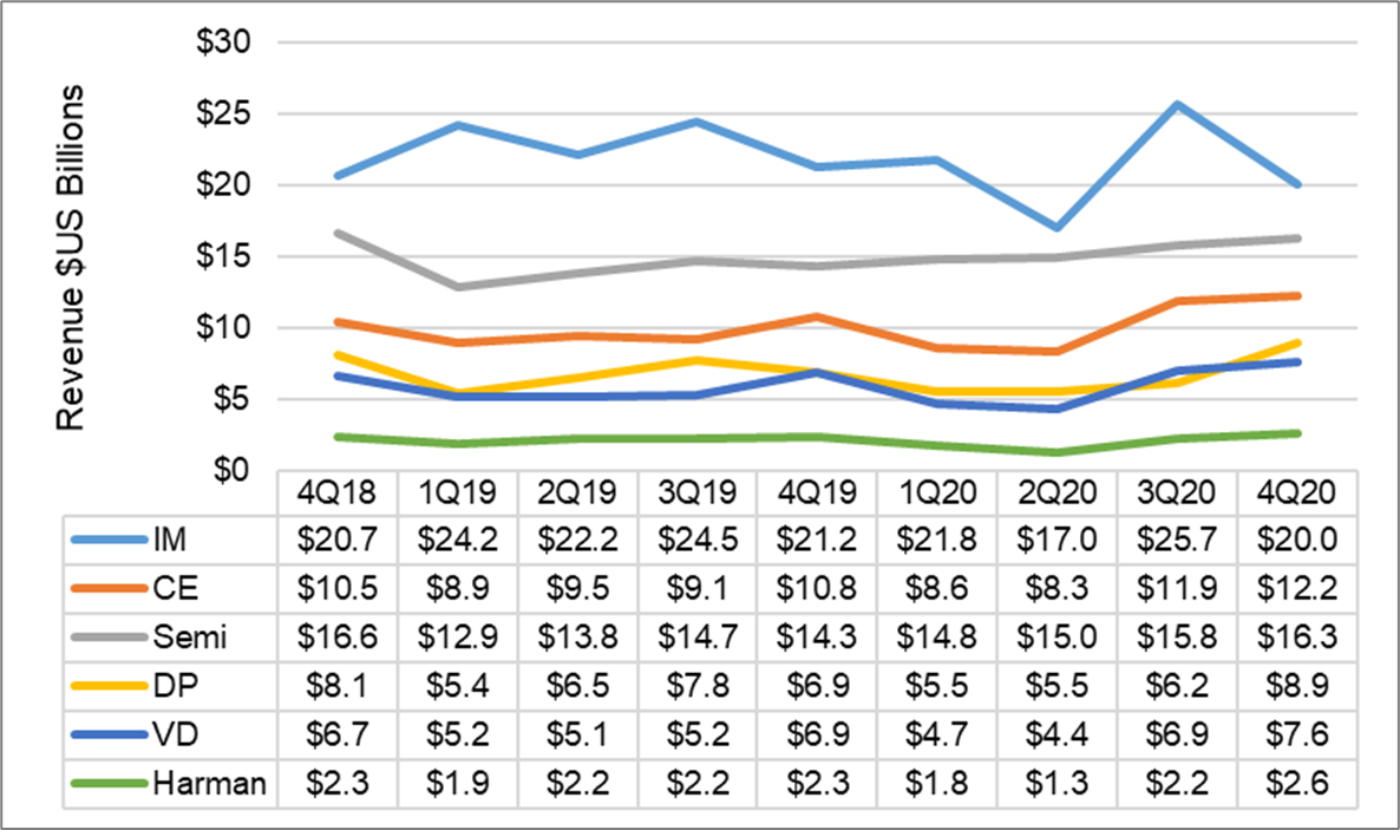
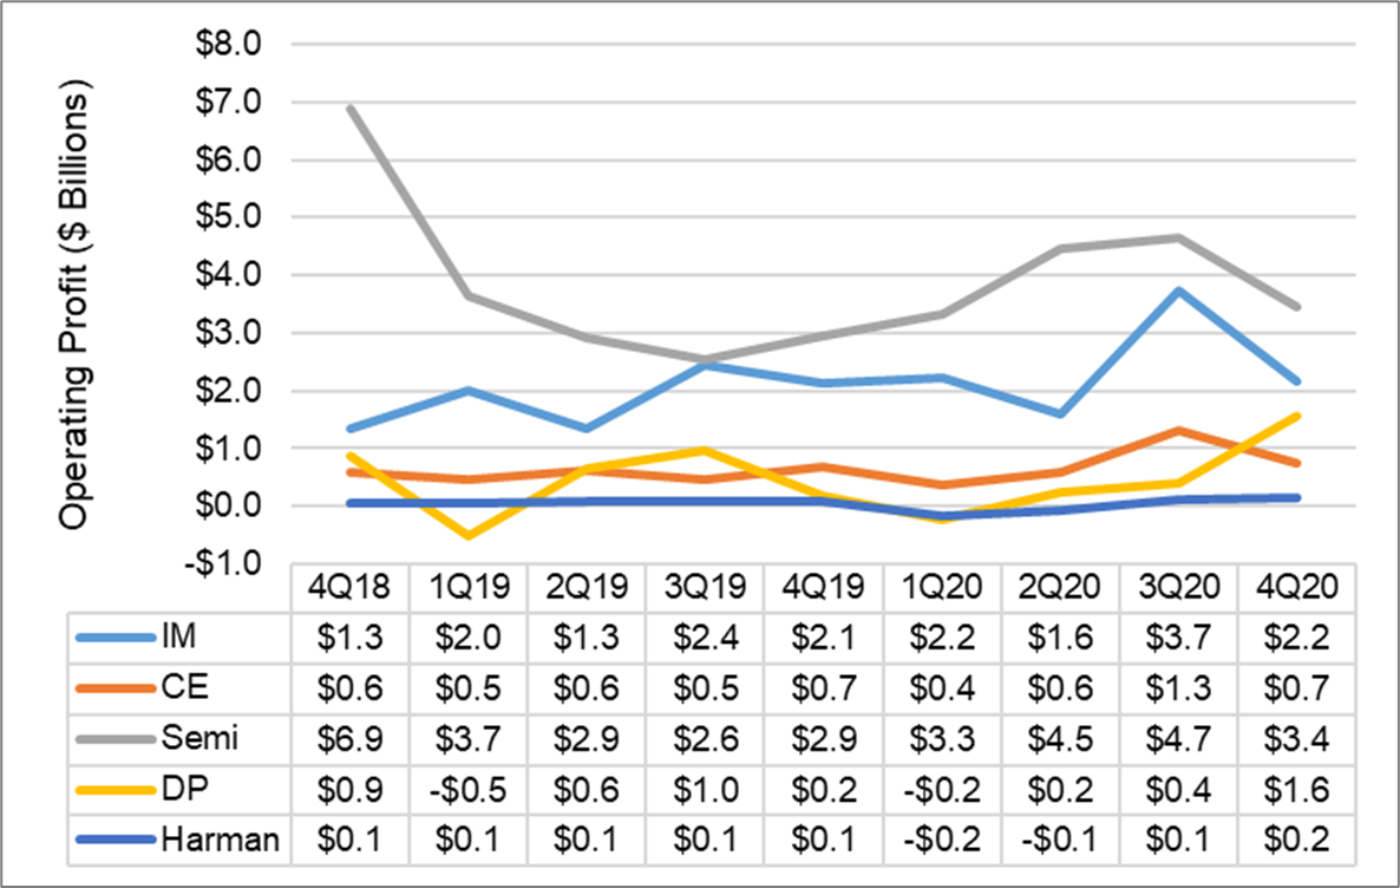
Samsung’s Semiconductor segment saw some ASP declines in memory that combined with currency headwinds and ramping costs for new fabs. Sequentially, DRAM bit growth increased by about 10% and ASP declined by a high-single digit%, while NAND bit growth was in the upper single digit%, and ASP declined by just over 10%. Samsung’s Consumer Electronics division saw earnings decreasing Q/Q and Y/Y because of increased panel costs and intensifying competition in the peak season.
Samsung’s Display Products division recorded an operating profit of KRW 1.72 trillion ($1.54 billion) on revenues of KRW 9.8 trillion ($8.8 billion). Revenues were up 43% Q/Q and 29% Y/Y, and operating profit increased 267% Q/Q and 721% Y/Y. Whereas Samsung’s IM division suffered from iPhone competition, the Display Products division benefitted from the strong demand for OLED panels. Similarly, the pain of the CE division became the gain for display, as Samsung’s large display business for LCD panels saw losses narrowing as LCD TV panel prices increased.
Samsung Display Performance by Technology, 3Q 2018 – 3Q 2020
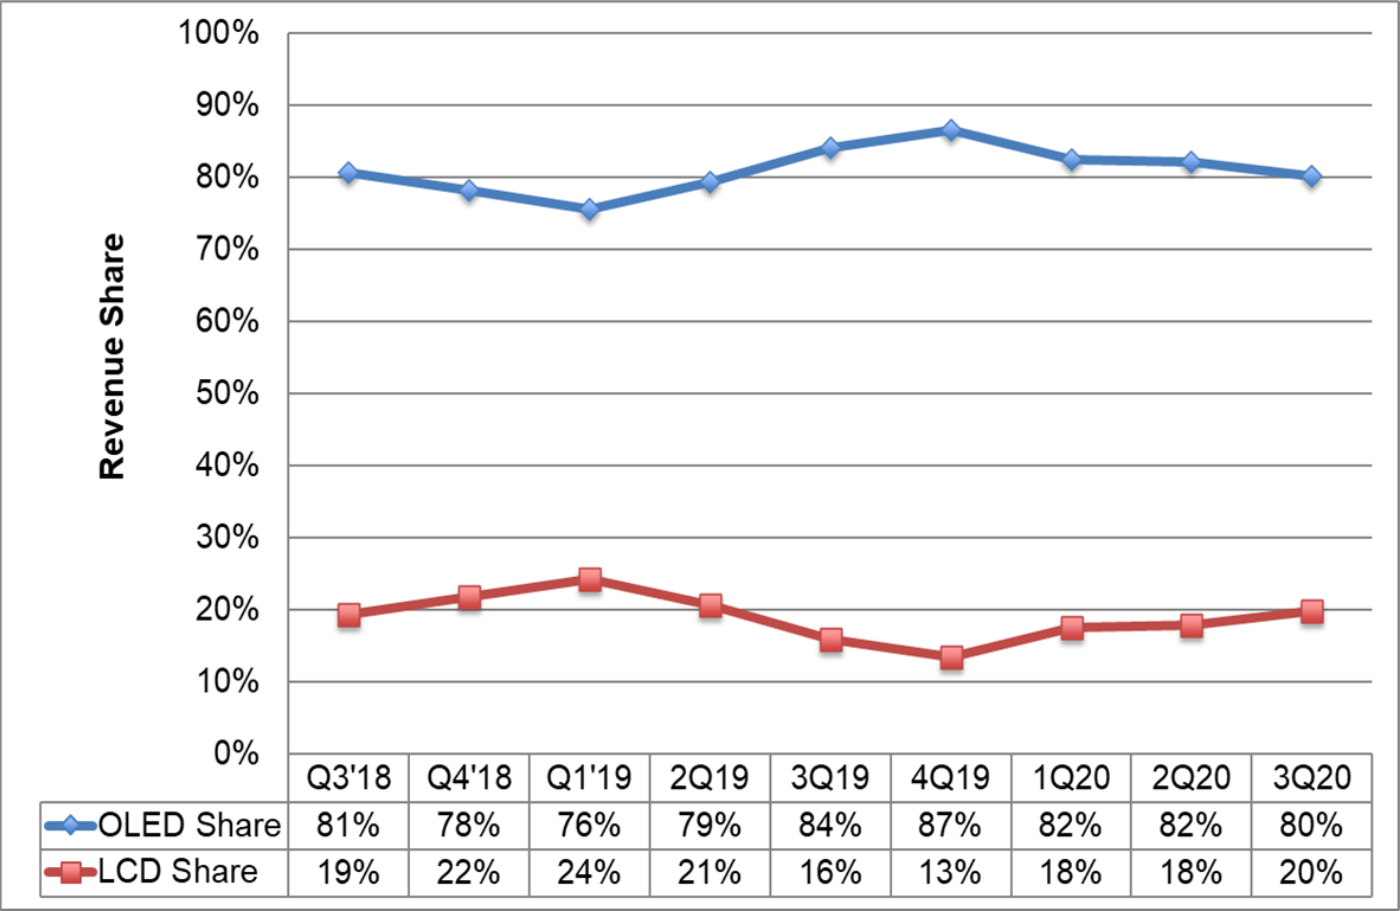
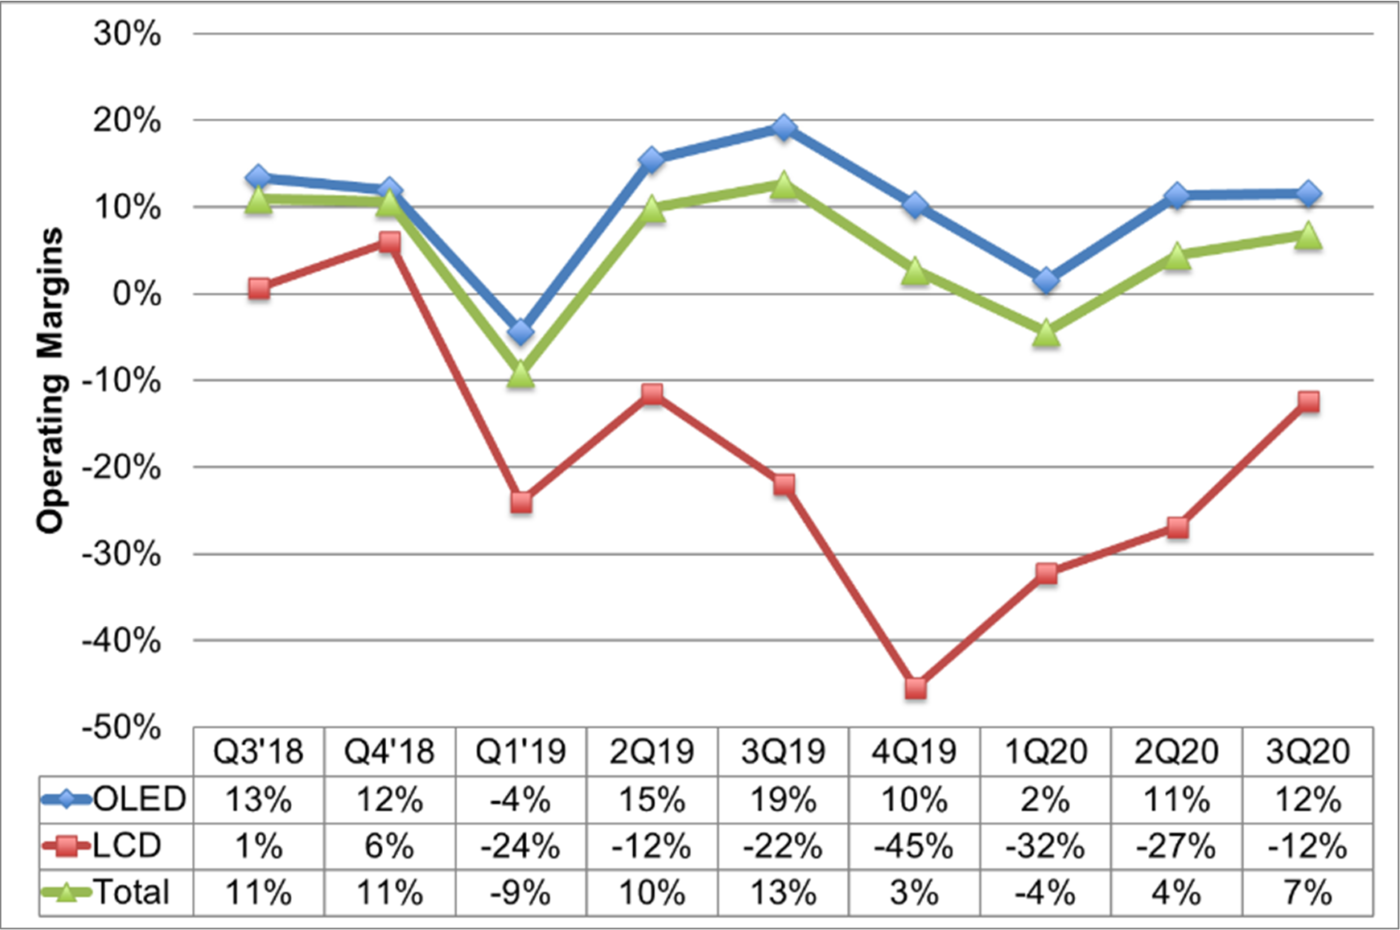
While the LCD business improved for the fourth quarter in a row, it still recorded a loss of KRW 83 billion ($74 million). While Samsung will continue to run LCD TV lines in 2021, it reaffirmed its main efforts will be converting capacity to QD display.
In Q1 2021, Samsung expects Semi to see Memory earnings decrease due to a weak dollar and high initial costs for new fabs despite strong demand driven by 5G mobile. Samsung expects DRAM market demand to decline by mid-single digit %, but Samsung expects to do slightly better. In NAND, Samsung expects bit market demand growth of 10% sequentially, and Samsung expects to be in line with the market.
Samsung’s outlook for its TV business was devoid of any quantitative assessment; the company touted the benefits of its Neo QLED flagship TV with MiniLED backlights.
In Display, Samsung expects the normal seasonal slowdown Q/Q in OLED smartphone panel sales, but expects revenues to increase Y/Y on higher UT%. The large panel business will continue QD display preparations as planned, as it also fully addresses LCD demand. Samsung is planning to continue to increase its foldable portfolio and widen the price ranges for foldable, and described introducing “several form factor” smartphone designs.
Samsung continues to post heavy capital expenditures, with KRW 10.6 trillion ($9.5 billion) in capex in Q4. The bulk of those investments go into the Semiconductor business, but Display capex was KRW 700 brillion (US$626 million) Samsung has been investing in tools for its QD-OLED business as well as LTPO and Y-OCTA for mobile.
Like many of Samsung’s US competitors, and unlike most companies in the display industry, Samsung’s balance sheet boasts a mountain of cash. Samsung had KRW 125 trillion ($112 billion) of cash and short-term investments at the end of Q4, and shows minimal debt and negative debt/equity. Samsung indicated that it would increase cash distribution, returning 50% of free cash flow to shareholders and increasing dividend payout from KRW 9.6 trillion to 9.8 trillion. Samsung posted KRW 13.9 trillion ($12.4 billion) of FCF in the fourth quarter.
In the display industry, Samsung stands apart for its technology capability, its vertical integration and its profitability.
About Counterpoint
https://www.displaysupplychain.co.jp/about
[一般のお客様:本記事の出典調査レポートのお引き合い]
上記「国内お問い合わせ窓口」にて承ります。会社名・部署名・お名前、および対象レポート名またはブログタイトルをお書き添えの上、メール送信をお願い申し上げます。和文概要資料、商品サンプル、国内販売価格を返信させていただきます。
[報道関係者様:本記事の日本語解説&データ入手のご要望]
上記「国内お問い合わせ窓口」にて承ります。媒体名・お名前・ご要望内容、および必要回答日時をお書き添えの上、メール送信をお願い申し上げます。記者様の締切時刻までに、国内アナリストが最大限・迅速にサポートさせていただきます。