国内お問い合わせ窓口
info@displaysupplychain.co.jp
FOR IMMEDIATE RELEASE: 12/06/2021
LCD TV Panel Prices Continuing to Fall
Bob O'Brien, Co-Founder, Principal AnalystAnn Arbor, MI USA -
After the two months with the fastest price declines in the history of the industry in September and October, LCD TV panel prices continued to fall in November, but the pace of price decreases is slowing, and we expect that pattern to continue into 2022. After two months where the average decline in LCD TV panel prices exceeded 15%, the average decline in November among the seven TV sizes we track was “only” 6.4%. LCD TV panel prices have now lost most of the gains that they achieved in the long up-cycle from May 2020 to June 2021.
In our summer updates, we referred to a series of events that suggested slowing demand and increasing supply, and nothing in autumn has disrupted this outlook. The increasing panel prices led to an unprecedented increase in TV prices in the US and around the world, which will hinder demand. After nearly a year where component shortages and logistics problems had brands and retailers scurrying to find enough supply, inventory is now more than sufficient across the LCD value chain from panel makers to retailers. Panel maker inventory at the end of Q3, had increased by almost $6B compared to a year ago.
Although demand signals are not strong, nevertheless several factors have combined to moderate the price declines during Q4. The potential for power disruptions in China to constrain supply means a risk of possible shortage. Although the impact of China’s power disruptions has not been significant to date, the uncertainty of the situation leads to a “fear of shortage” that can support prices. Several panel makers have slowed down their utilizations in Q4, reducing some of the supply-side pressure. Perhaps most importantly, the steep price reductions in the autumn have created opportunities for aggressive promotion of lower-priced TVs in the holiday selling season.
The first chart here highlights our latest TV panel price update, showing both the biggest price increases in the history of the flat panel display industry, from May 2020 to June/July 2021 and then the fastest price decreases in the industry in the autumn of 2021. With additional price decreases in November, and compared to the price increases in November 2020, all sizes of panels up to 55” are now at lower prices Y/Y, although the largest size panels (65” and 75”) were flat Y/Y in November.
LCD TV Panel Prices January 2020 - March 2022
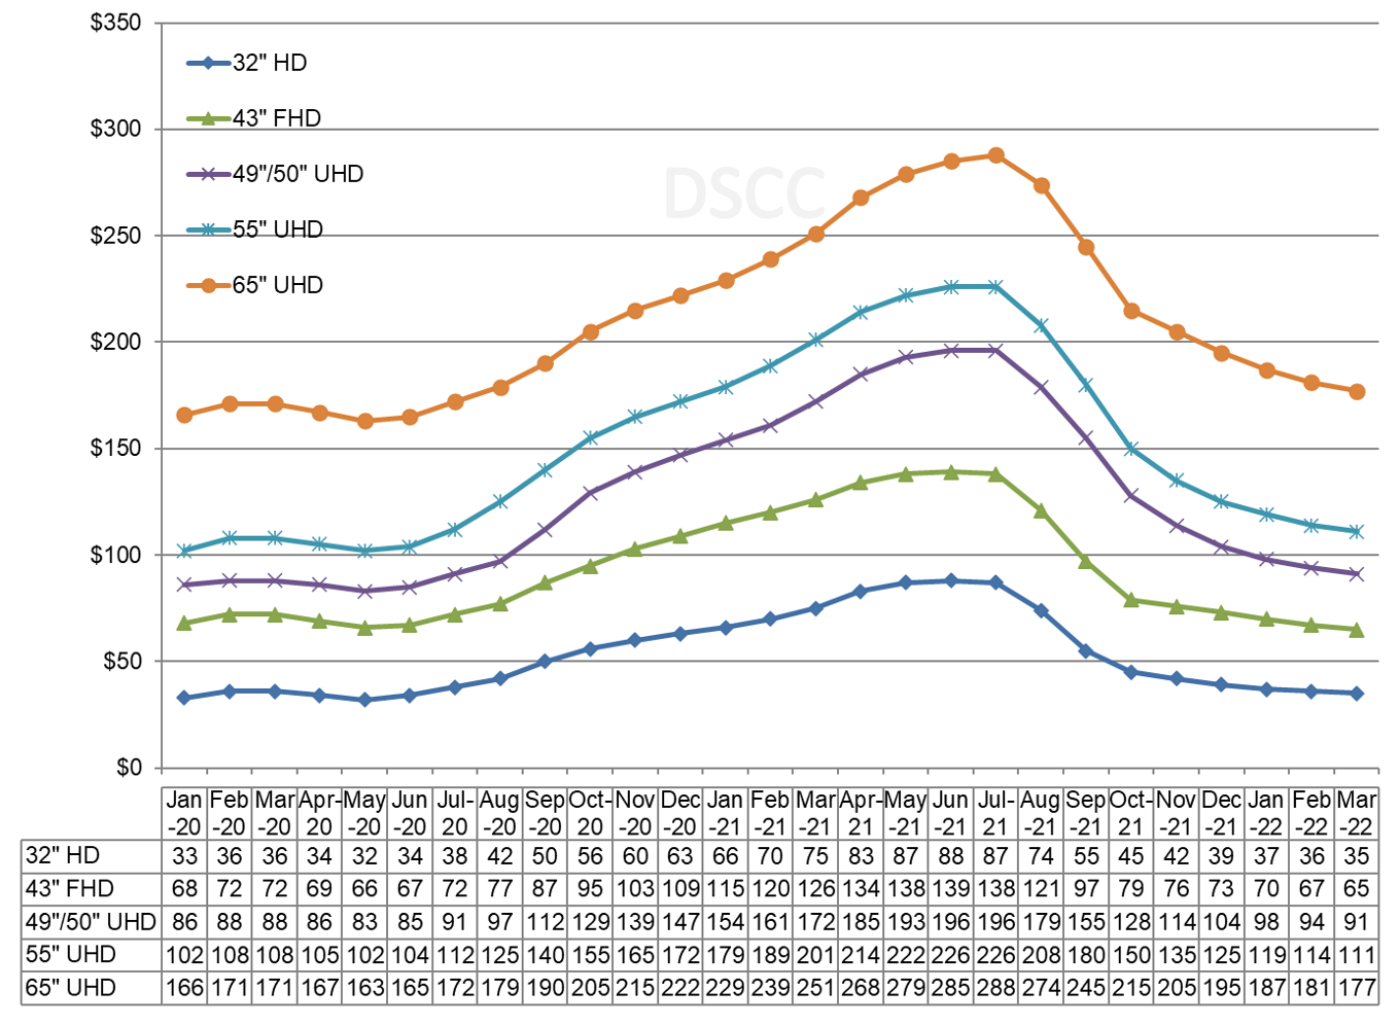
In November, prices for all TV panel sizes fell, with the largest percentage declines occurring in the two sizes that are optimized on Gen 8.5/Gen 8.6 fabs. Prices for both 49”/50” panels and 55” panels declined by 10%, while both smaller and larger sizes had single-digit price declines M/M.
Although we are seeing panel price declines coming more slowly in Q4, much of the damage has been done. With the additional price declines that we expect in December, we expect prices to decline by 32%, with the Q/Q price declines ranging from 18% to 41%.
As we look at pricing on an area basis, we have noted that smaller screen TVs are the most commoditized: prices for 32” panels fall the fastest during a period of oversupply and rise the fastest during a period of shortage. That pattern has repeated with oversupply. At the peak of the recent upswing, the smallest TV panels sold with an area premium, but the shift to oversupply has caused that pattern to flip, as shown in the next chart.
Monthly Area Prices per Square Meter for TV Panels, January 2018 - March 2022
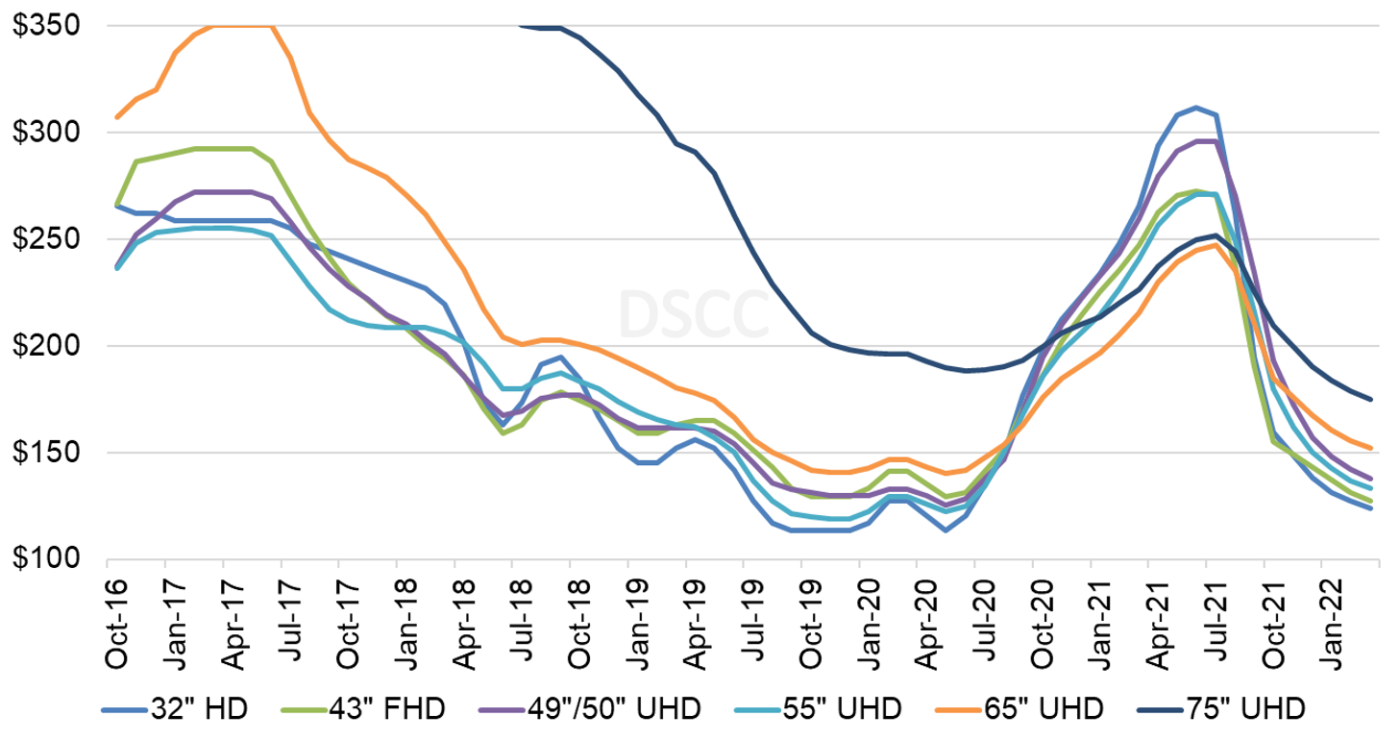
At the peak of panel prices in June 2021, 32” panels sold at a premium of $67 per square meter or 27% over 65” panels, and $62 or 25% over 75” panels. That premium was gone by September and by November 32” panels sold at a discount of $27 or 15% compared to 65” panels and at a discount of $51 or 27% compared to 75” panels. The chart shows that 75” panels, while they are subject to the supply/demand dynamics of the industry, are by far the least volatile screen size. Panel makers with Gen 10.5 capacity (BOE, CSOT and Sharp SIO) will be at a relative advantage in the oversupply environment that will carry into 2022.
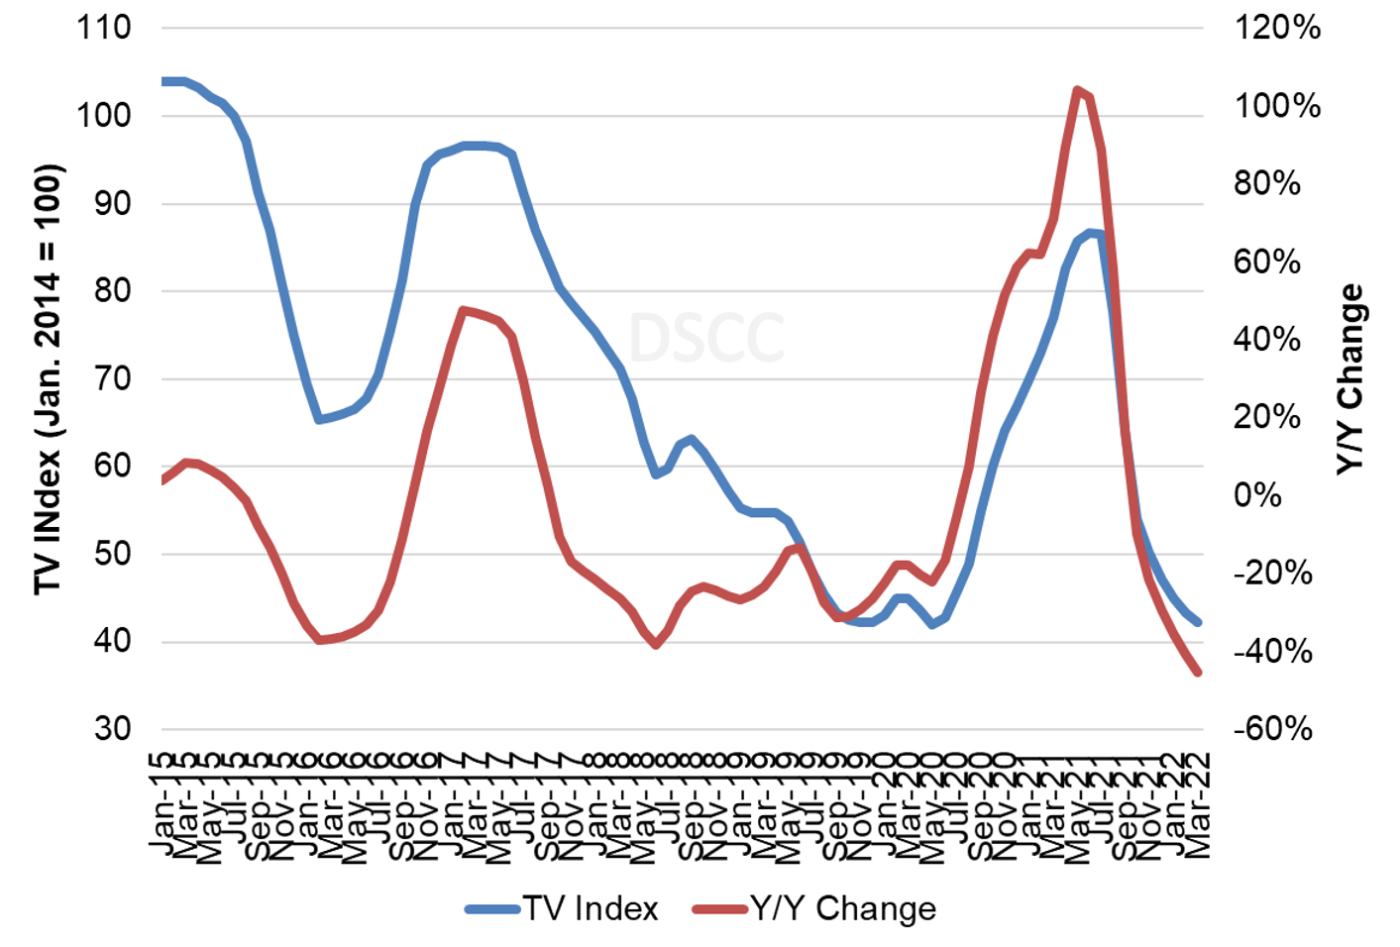
The last chart here shows our TV price index, set to 100 for prices in January 2014, and the Y/Y change of LCD TV panel prices. Our index increased from its all-time low of 42 in May 2020 to 87 in June 2021, but prices have already fallen to 50 in November. We now expect the index to decline to 47 at year-end, 29% lower than in December 2020, but still 12% higher than in May 2020. The Y/Y increase in November stood at -22%.
TV Panel Price Index and Y/Y Change, January 2015 - March 2022
As we have described in DSCC’s Quarterly All Display Fab Utilization Report (一部実データ付きサンプルをお送りします), some panel maker utilizations are slowing down in Q4 to help alleviate the pressure on prices. In a communication to investors last week, Corning reiterated that such a slowdown is starting to happen. We expect utilizations to slow further in Q1 as prices continue to fall.
With the COVID-19 demand surge assisted by shortages in glass and DDICs, we saw a historic year of increases in panel prices, and panel makers post their most profitable quarter ever in the second quarter of 2021. Profits declined in Q3 but not by much, and the third quarter was the second-best quarter ever for panel maker profitability, surpassed only by its predecessor. Even price declines in Q4 will sustain some profitability for LCD panel makers, who continue to be in line for record full-year profits.
About Counterpoint
https://www.displaysupplychain.co.jp/about
[一般のお客様:本記事の出典調査レポートのお引き合い]
上記「国内お問い合わせ窓口」にて承ります。会社名・部署名・お名前、および対象レポート名またはブログタイトルをお書き添えの上、メール送信をお願い申し上げます。和文概要資料、商品サンプル、国内販売価格を返信させていただきます。
[報道関係者様:本記事の日本語解説&データ入手のご要望]
上記「国内お問い合わせ窓口」にて承ります。媒体名・お名前・ご要望内容、および必要回答日時をお書き添えの上、メール送信をお願い申し上げます。記者様の締切時刻までに、国内アナリストが最大限・迅速にサポートさせていただきます。